Thursday, January 7, 2010

Fractal Adaptive Cycles in Natural and Human Systems

OilDrum jätkab heade artiklitega.

Adaptive cycles are the foundation of both natural ecological and human socio-economic systems, and have been investigated independently from very different perspectives by ecologists and financial analysts who have almost certainly never heard of each others' work. It is interesting then to look at the strong correspondence of the self-similar hierarchical patterns, best described as fractals, which emerge from both fields. This form of organization seems to be a fundamental dynamic in many areas.
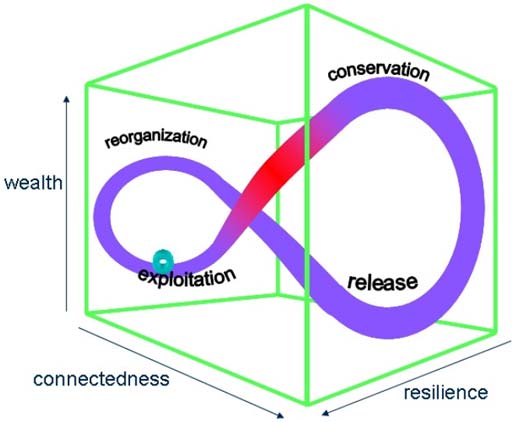

The bewildering, entrancing, unpredictable nature of nature and people, the richness, diversity and changeability of life come from that evolutionary dance generated by cycles of growth, collapse, reorganization, renewal and re-establishment. We call that the adaptive cycle.
Holling, 2009
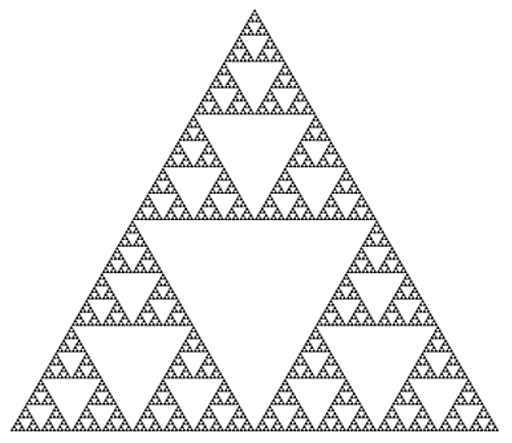

Figure 1: Sierpinski Triangle Fractal

Holling, Panarchy and Resilience

Arguably the most significant thinker in the field of ecological cycles has been Buzz Holling, who refers to the conceptual model he derived from the study of forest ecosystems as Panarchy. Holling observed that ecosystems developed in adaptive cycles of exploitation, conservation, release and reorganization which could be described in three dimensions - ecological 'wealth', connectedness and resilience. These cycles provide a framework for the opposing forces of growth and stability versus change and variety.


Figure 2: Adaptive Cycle in Three Dimensions

In an adaptive cycle, early growth is rapid as individuals of many species arrive in a newly opened space and seek to exploit a plethora of vacant ecological niches. Genetic diversity and biomass, both living and dead, increase quickly in this expansion phase. Ecological connections are initially simple and sparse, but over time many interconnections and mutual dependencies develop. The system therefore increases in both 'wealth' and connectedness, as flows of energy and materials become larger and more complex. Biological 'wealth' confers the potential for novelty, allowing the system to adapt in disparate directions as circumstances warrant. Connectedness permits increasing stability, through the development of negative feedback loops, which help to regulate conditions conducive to life.

As time passes, rapid growth gives way to conservation. Inter-dependencies become highly specialized and self-regulation becomes fine-tuned and sophisticated. Efficiency is maximized as niches are fully occupied, and flows of energy and nutrients are tightly controlled by the existing biota. This represents the end of the growth phase. Relatively few opportunities are left for newcomers or novel strategies, hence diversity stabilizes or declines. The system is 'rich', but becomes more rigid, and therefore less resilient in the face of potential shocks, which can propagate rapidly through a highly inter-connected system with smaller margins for error than it had in its generalist phase. An increasingly brittle ecosystem becomes, in Holling's words, "an accident waiting to happen".

When something does push the ecosystem outside of the boundaries it can tolerate, the long growth phase can morph into a rapid and chaotic release and reorganization phase, where nutrients and energy stores previously tied up can suddenly be liberated. This can be associated with a considerable loss of complexity, but also with much greater potential for generalist strategies and for novelty.
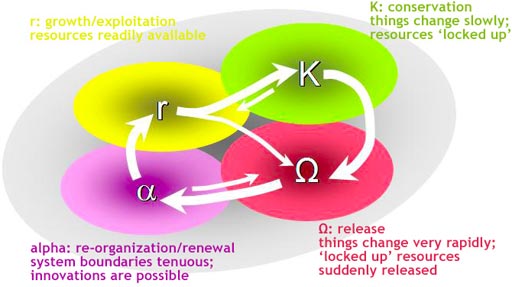

Figure 3: Adaptive Cycle Stages
  • During the growth phase the system finds an abundance of resources available. Expansion and exploration of new opportunities are key concepts within this stage. “When new ecological spaces open up – due, for instance, to forest fires, or retreating glaciers, or many other things- resources needed for other species to grow are made available. There’s more light reaching the soil surface when large trees are toppled, or burned to the ground, for example.”
  • “The "r" phase is transitory, and as the system matures, it is replaced by the K phase. Eventually slower growing, long lived species or entities enter the system. Resources become less widely available as they become “locked up”… The K phase is sometimes called the conservation phase, because energy acquired goes into maintaining or conserving existing structure, rather than building new structure. In this phase, a few dominant species or companies or countries … have acquired many of the resources and are controlling the way they can be used.”
  • “Often systems rapidly pass into a phase called omega. This is also referred to as the release (or creative destruction) phase because structure, relationships, capital or complexity accumulated during the r and K phases is released (often in a dramatic or abrupt fashion). … Plants may die … or a company may go bankrupt, releasing workers and decommissioning factories or offices.”
  • “The fourth, or alpha phase, is a period of reorganization, in which some of the entities previously released begin to re-structure but not necessarily as they were before. This phase can mark the beginning of another trip through an adaptive cycle … Many new entities may enter the system, and innovation becomes more probable.” Project Shrink

However, such adaptive cycles do not exist in isolation. Local ecosystem cycles are embedded in larger and slower-moving regional cycles operating over years and decades, which are in turn part of global climate and elemental cycles (carbon, nitrogen, phosphorus etc) that may unfold over centuries or millennia. These larger cycles can act as stabilizing factors by adding a 'memory effect', or wealth reservoir, enabling rapid regeneration following a localized setback, but only if the larger cycle is not in its own contraction and reorganization phase. In addition to being part of larger cycles, dynamic ecosystems are also composed of smaller and faster-moving cycles of growth and decay, operating on much shorter time horizons. This nested set of self-similar structures allows for both persistence and innovation.
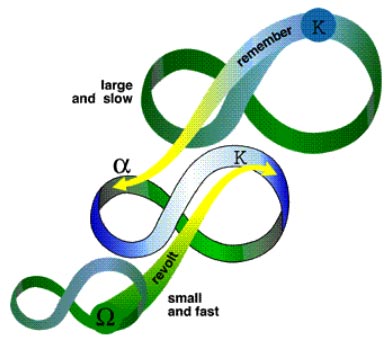

Figure 4: Panarchy (Nested Adaptive Cycles)

Where higher and lower order cycles are very tightly coupled, they may synchronize, becoming trapped in a extended growth phase at many scales at once, thereby risking synchronous collapse. This need not be triggered at a large-scale level, but can begin anywhere in a set of nested adaptive cycles and proceed both upwards and downwards. A destabilizing event arising from below, for instance a disease outbreak leading to widespread morbidity and further adverse consequences, is called a 'revolt'. A synchronous collapse, which can take the form of a "pancaking implosion", to use Holling's term, can lead to a poverty trap, or persistent maladaptive state characterized by low 'wealth' and connectivity, which is very much more difficult to recover from than a localized reversal would have been.

By way of illustration, the Canadian province of British Columbia is currently facing a confluence of circumstances that pose a significant large-scale ecological threat. A long-standing policy of fire-suppression, in a hitherto naturally fire-controlled ecosystem, has led to a thick understory of growth, which has in turn caused significant stress to trees forced to compete for water and nutrients in an area becoming warmer and drier. Trees under stress have much lower resistance to pine beetle infestation, with the result that a pine beetle population explosion is killing huge tracts of forest despite all efforts to contain the outbreak. This adds to the combustible material on the forest floor and greatly increases the risk of widespread conflagration. The much smaller self-limiting fires typical of the province would have opened up areas for new growth, killed insect pests and released nutrients for regeneration, and in fact are required by some tree species in order to open up seed pods for reproduction. In contrast, very large and intense fires, fueled by a tremendous excess of flammable detritus, can comprehensively denude enormous tracts of land. This can remove the biological reservoir of potential repopulating species as well as lead to enough soil erosion to inhibit regrowth of the forest ecosystem. An interlocking series of adaptive cycles has been synchronized through being locked into an extended growth phase and is therefore much more vulnerable to a catastrophic event that could become a lasting poverty trap.

When collapse occurs it can be a natural part of the pattern of adaptation and learning. That is what happens in forests when they burn or are attacked by natural enemies. Recovery typically replaces the old with a similar but new pattern that is similar because of the memory reserved in seeds and vegetation of the understory.

But when the collapse occurs as a consequence of long effort to freeze the system into one paradigm of development and management, then it might involve collapse of a level of the panarchy, which in turn threatens other levels. The collapse of ancient societies has this character- the top religious and political controls can collapse, triggering the gradual collapse of institutions till the family is left as the sole source of survival. It leads to a "poverty trap." Holling, 2009

Much of Holling's work has focused on the crucial role of resilience in both natural and human systems, and the Resilience Alliance has been the result:

We define resilience, formally, as the capacity of a system to absorb disturbance and reorganize while undergoing change so as to still retain essentially the same function, structure and feedbacks - and therefore the same identity.

Resilience arises from a redundancy that has the appearance of inefficiency and a lack of critical structural dependency on specialized hierarchy, neither of which conditions are likely to be met at the peak of the growth phase of an adaptive cycle. For these to be achieved from this point at least a partial, or localized, collapse to a simpler level of organization would have to occur. There can potentially be a fine line between a retreat from rigidity to this level of resilience and a 'poverty trap', where a collapse has proceeded so far and so fast that the system has been stripped of the wealth (biological or otherwise) that it would need to rebuild. Where adaptive cycles have become synchronized, so that the likelihood of deep collapse is increased, striking a balance of resilience would be far more difficult.

  • A resilient world would promote biological, landscape, social and economic diversity. Diversity is a major source of future options and of a system's capacity to respond to change.
  • A resilient world would embrace and work with natural ecological cycles. A forest that is never allowed to burn loses its fire-resistant species and becomes very vulnerable to fire.
  • A resilient world consists of modular components. When over-connected, shocks are rapidly transmitted through the system - as a forest connected by logging roads can allow a wild fire to spread wider than it would otherwise.
  • A resilient world possesses tight feedbacks. Feedbacks allow us to detect thresholds before we cross them. Globalization is leading to delayed feedbacks that were once tighter. For example, people of the developed world receive weak feedback signals about the consequences of their consumption.
  • A resilient world promotes trust, well developed social networks and leadership. Individually, these attributes contribute to what is generally termed "social capital," but they need to act in concert to effect adaptability - the capacity to respond to change and disturbance.
  • A resilient world places an emphasis on learning, experimentation, locally developed rules, and embracing change. When rigid connections and behaviors are broken, new opportunities open up and new resources are made available for growth.
  • A resilient world has institutions that include "redundancy" in their governance structures and a mix of common and private property with overlapping access rights. Redundancy in institutions increases the diversity of responses and the flexibility of a system. Because access and property rights lie at the heart of many resource-use tragedies, overlapping rights and a mix of common and private property rights can enhance the resilience of linked social-ecological systems.
  • A resilient world would consider all nature's un-priced services – such as carbon storage, water filtration and so on - in development proposals and assessments. These services are often the ones that change in a regime shift – and are often only recognized and appreciated when they are lost. Walker, 2008

This will be a very tall order in a panarchic future.

Prechter, Elliottwaves and Socionomics

Bob Prechter has also spent decades studying the structure of nested cycles, but in his case in financial markets, carrying on the work of RN Elliott, who established the field in the 1930s. Elliott painstakingly documented motive (impulse) and corrective patterns which unfold at all degrees of trend simultaneously - from small moves completing in minutes to larger cycles playing out over months, years, decades and longer. Elliott noted that motive waves in the direction of the one larger trend occur in fives, while corrective waves counter to the one larger trend form threes or multiples thereof.

Prechter explains that this is the minimum requirement for an adaptive cycle capable of both fluctuation and progress, and therefore the most efficient form. Each move itself is composed of the same patterns, while each also forms a component part of larger structures. (Motive waves are labeled with numbers, while corrective waves are labeled with letters.)
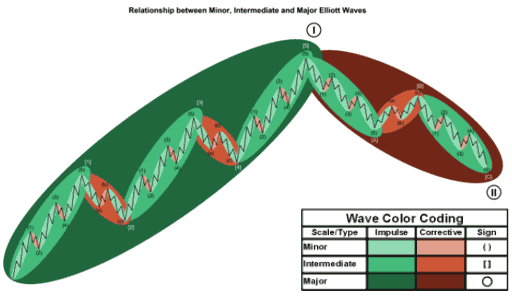
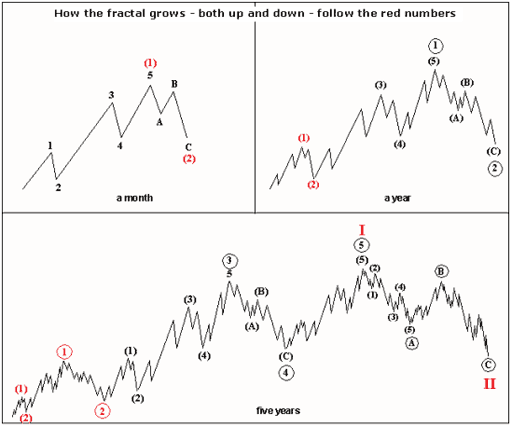
Figure 5: Motive and Corrective Elliottwaves at Different Degrees of Trend

Figure 6: Fractal Market Structure at Different Timescales

As opposed to self-identical fractals, whose parts are precisely the same as the whole, and indefinite fractals, which are self-similar only in that they are similarly irregular at all scales, a robust fractal is one of intermediate specificity. Though variable, its component forms, within a certain defined latitude, are replicas of the larger forms. Prechter, 1999, p17
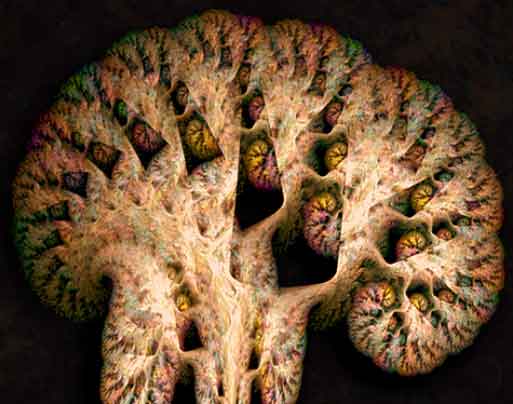

Figure 7: The Brain as a Robust Fractal

Bob Prechter's socionomics model combines Elliott's observed fractal patterns with an understanding of human herding behaviour, comprising a comprehensive challenge to prevailing notions such as the Efficient Market Hypothesis by reversing causation and recognizing the role of emotional/irrational behaviour as the prime market driver. While the real economy demonstrates negative feedback loops, finance is thoroughly grounded in positive feedback.
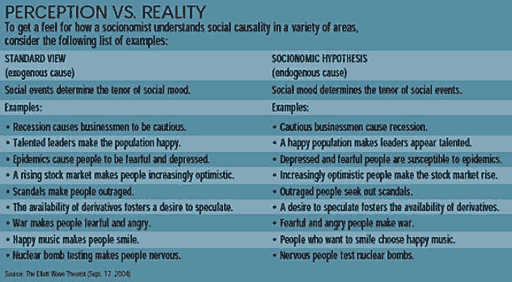

Figure 8: Perception Versus Reality in Socionomic Causation

Socionomics provides a model of collective mood swings which permits collective human behaviour prediction in finance, the real economy and beyond. Consensus takes time to build, so that the more extreme the sentiment, the closer one is to a trend change. Collectively optimistic people engage in one range of behaviours over different timescales - typically buy stocks, borrow funds to build businesses, employ others in the expectation of profit, vote for incumbents whom they credit with stability, engage in cheerful expressions of popular culture and behave in an increasingly inclusive manner in recognition of common humanity. Collectively pessimistic people become increasingly risk averse and suspicious of others, in whom they look for differences rather than similarities. Both optimistic and pessimistic behaviours, particularly in their extreme forms, can create self-fulfilling prophecies for varying periods of time, until perception substantially overshoots reality and the trends it creates can no longer be sustained. The manic trend of recent years has led to an unsustainable debt burden of unprecedented scope and complexity. It also led to an unprecedented degree of global economic and financial integration dependent on hierarchical specialization, comparative advantage and just-in-time delivery that are clear examples of rigidity creating a brittle system.
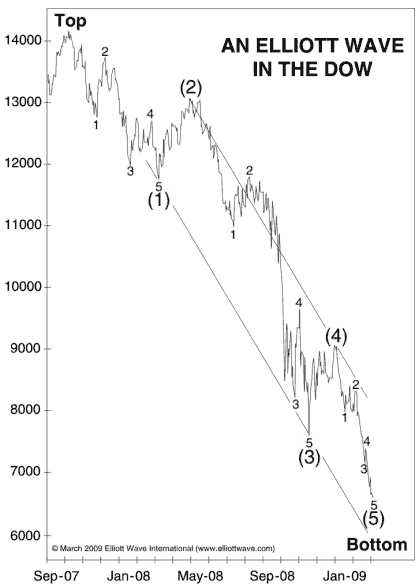

Figure 9: Phase 1 of the Decline with Elliottwave Labels

Like Holling's panarchy, Prechter's nested socionomic cycles either reinforce or counter each other depending on the direction of cycles larger and smaller than the one under consideration. Where cycles at several degrees of trend are moving in the same direction, the move will be extreme - either a mania to the upside or a crash to the downside. The largest mania ever known topped in the year 2000, and we have been in bear market territory since then (more obviously in real terms). We are now approaching a synchronized move in the opposite direction as the rally of recent months peters out in the face of the larger downtrend. The consequences of this will be considerable, but we are still quite near the beginning of the large-scale and complex downward pattern the model predicts will unfold over the next several decades. We can expect many deleveraging cascades and many intervening rallies, some larger than we have seen so far.
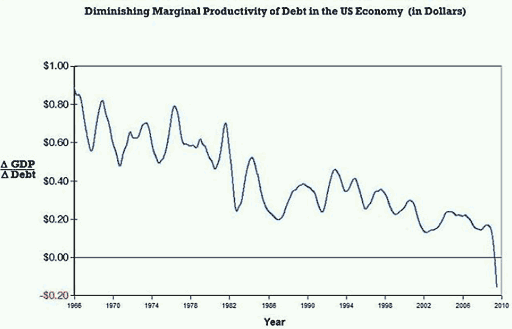

Figure 10: Diminishing Marginal Productivity of Debt in the US Economy

It is inevitable that the complex web of debt instruments and inter-dependencies that humanity invented to prolong its growth phase (to use Holling's terminology) by stealing from the future will be a prime focus for a sharp reversal, as we have already reached the point where additional debt provides less than no benefit. Socionomics tells us that the trust and complacency as to systemic risk that allowed this debt structure to develop will be primary casualties of a synchronized move to the downside, being both cause and effect in a powerful positive feedback loop.

Tainter, Complexity and Peer Polities

Joseph Tainter's work complements that of Holling and Prechter, providing a framework of diminishing marginal returns to complexity which encompasses ecosystems, individual societies and competitive peer polities. As complexity increases, it eventually becomes a liability, as we can see with Holling's description of rigidity reducing the resilience of ecosystems and Prechter's many writings on the debt complexity of manias and the systemic risk it engenders.
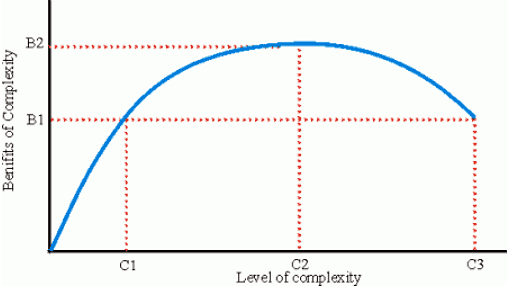

Figure 11: Declining Marginal Returns to Complexity

As with diminishing marginal productivity of debt, past a certain point further investments in complex solutions to increasingly complex problems has a negative return. Tainter explains, however, that where there is not a single political structure, but instead competitive peer polities, these entities become trapped in a competitive spiral where investment in organizational complexity must be maintained regardless of cost, as the alternative is domination by another member of the cluster at the same level of complexity, rather than collapse to a simpler system. The counter-productive actions of states are legitimized to the citizenry by the fact that each member of the cluster is engaging in the same behaviour. Collapse, which requires a power vacuum, is not possible unless the whole cluster collapses at once at the point of economic exhaustion.

Peer polity systems tend to evolve toward greater complexity in lockstep fashion as, driven by competition, each partner imitates new organizational, technological, and military features developed by its competitors. The marginal return on such developments declines, as each new military breakthrough is met by some counter-measure, and so brings no increased advantage or security on a lasting basis.. A society trapped in a competitive peer polity system must invest more and more for no increased return, and is thereby economically weakened. And yet the option of withdrawal or collapse does not exist.....Peer polity competition drives increased complexity and resource consumption regardless of cost, human or ecological. Tainter, 1988, p214

Tainter observes that the peer polity nature of the modern world creates a more apt comparison with the rapid collapse of the ancient Maya than with the slow decline of Rome. To use Holling's terminology, we have seen a panarchy of nested cycles synchronize, with the effect of artificially extending the growth phase for all simultaneously. The evidence for this is abundantly available in terms of the many limits to growth we are approaching or have reached, most notably the high EROEI energy required to maintain complexity. The significant risk is therefore of deep collapse over a relatively short period of time (although this would still likely be decades at least).

Collapse, if and when it comes again, will this time be global. No longer can any individual nation collapse. World civilization will disintegrate as a whole. Competitors who evolve as peers collapse in like manner. Tainter, 1988, p214

References

  • LH Gunderson and CS Holling (2001). Panarchy: Understanding Transformations in Human and Natural Systems.
  • RR Prechter (1999). The Wave Principle of Human Social Behaviour and the New Science of Socionomics.
  • RR Prechter (2002). Conquer the Crash.
  • RR Prechter (2003). Pioneering Studies in Socionomics.
  • JA Tainter (1988). The Collapse of Complex Societies.

Postscript:

There are about three kinds of scientists - the consolidator, the technical expert, and the artist. Consolidators accumulate and solidify advances and are deeply skeptical of ill formed and initial, hesitant steps. That can have a great value at stages in a scientific cycle when rigorous efforts to establish the strength and value of an idea is central. Technical experts assess the methods of investigation. Both assume they search for the certainty of understanding.

In contrast, I love the initial hesitant steps of the "artist scientist" and like to see clusters of them. That is the kind of thing needed at the beginning of a cycle of scientific enquiry or even just before that. Such nascent, partially stumbling ideas, are the largely hidden source for the engine that eventually generates change in science. I love the nascent ideas, the sudden explosion of a new idea, the connections of the new idea with others. I love the development and testing of the idea till it gets to the point it is convincing, or is rejected. That needs persistence to the level of stubbornness and I eagerly invest in that persistence. Holling, 2009

(Original here).

A Net Energy Parable: Why is ERoEI Important?

EROEI on lihtne, loogiline, huvitav ja samas tähelepanuta (vähemalt minu teadvuse jaoks) jäänud indikaator. Uurime seda edasi. Mõtleme oma tulevikule ja kohalikele kinnisvarahindadele. Arikkel TheDrumOilist.

For most living things, energy is calories. Over eons, natural selection has optimized the most efficient methods for energy capture, transformation, and consumption.( Lotka) Cheetahs that repeatedly expend more energy chasing a gazelle than they receive from eating it will not incrementally survive to produce offspring.


But humans, in a very brief evolutionary time span, have puzzled out how to unlock the hydrocarbon bonds in fossil fuels, freeing up vastly more energy that can be directly eaten. The vast majority of our per capita energy production is spent on non-nutritive exosomatic consumption. We have gradually, with rapidity at times, advanced modern human civilization to a global scale, with liquid fuel in jets, trucks, and automobiles providing the glue that links people and products together.


WHAT IS NET ENERGY?

To harness and consume energy requires some type of energy investment. This investment is what comprises the difference between gross energy and net energy. There is various nomenclature that describes this concept. Energy profit ratio, surplus energy, energy gain, EROI, and ERoEI all represent virtually the same relationship of how much energy we receive, relative to an energy input(dollars do not factor in). The most referenced metric in the Peak Oil literature is EROI or ERoEI (Energy Returned on Energy Invested), which, in its simplest sense is the ratio:

Energy Output / Energy Input

There is disagreement (sometimes dramatic) in the energy literature not only as to what should be included as energy inputs and outputs (a boundary issue) but how variables are included (how to evaluate co-products, how to include other limiting inputs to an energy technology, etc) These nuances will be covered in a subsequent post.

Net energy is typically given as per unit of energy invested. Thus:

EROI = Net Energy + 1.

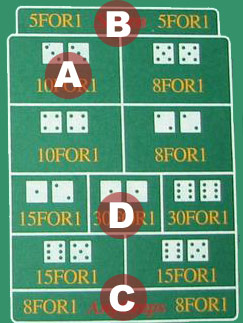
(For those of you who've played craps - some tables pay off the hard-ways FOR one and others TO one. EROI and net energy have a similar relationship. EROI is how much energy output FOR an energy input and net energy is the energy output TO the energy input.)

Net energy also can refer to a sum as well as a ratio. For an ethanol process that has an EROI of 1.2:1 -the net energy is just .2, but we can also calculate how much net energy is created for society in a given year or a life-of-resource total. At EROI of 1.2, the 3.9 billion gallons that the US produced in 2005 required 3.29 billion gallons of BTU energy input, resulting in a `net energy' of 610 million gallons. (This post will use net energy and EROI interchangeably - if a sentence uses EROI, just subtract one to get net energy, if I use net energy, just add one to get EROI)

A GROSS vs NET ENERGY GRAPH

Briefly, the above graph shows a theoretical depletable resource which follows the 'best first' concept of resource extraction. The vertical axis is quantity and the horizontal is time. The gross energy resource "X", is the entire area under the curve. ("X" = "A"+"B"+"C"+"D"). Direct energy costs are "D". Indirect energy costs (like tractors and highways and medical insurance and such) are "C". Environmental externalities (in energy terms) are "B". "A" represents the total net energy of the resource after costs have been subtracted. At any given point in time the EROI can be calculated by taking a ratio of the total area divided by the costs (depending on the boundaries). As can be seen, net energy peaks and goes to zero way before the total gross energy is depleted. (This graphic is from an upcoming paper on EROI by a colleague (Kenneth Mulder) and myself.)

ENERGY QUALITY

Energy quality is also relevant. From an economic standpoint, the value of a heat equivalent of a fuel is set by its price, energy density, physical scarcity, cleanliness of the fuel, capacity to do useful work, flexibility, safety, conversion aspects, etc. (1)


(Source - Neal Elliot - ACEEE)

Electricity is currently the highest quality energy we have in our society, largely due to its ability to do work. Although crude oil is of lower energy `quality' than electricity, its use is ubiquitous in allowing other segments of society to transport goods, etc. and its `quality' as measured by price, has been increasing relative to electricity in recent years.

Cutler Cleveland et al. devised one method of `quality correcting' the net energy of oil and gas extraction using, The Divisia Index, which accounts for energy quality of both inputs and outputs(1 )Below is a graphic of the the thermal and quality corrected EROI of US oil and gas extraction.

"The Divisia EROI is consistently much lower than the thermal equivalent EROI. The principal reason for this is the difference in the fuel mix, and hence fuel quality, between the numerator and denominator of the EROI. The outputs are the crude, unprocessed forms of oil and natural gas. The inputs are electricity and refined fuels such as gasoline and other distillate fuels. The latter are higher quality than the former, and have higher prices. Refined fuels and electricity are, therefore, weighted more heavily in the Divisia formulation."(1)

In the 1930s, US oil was easy to discover. In many cases it was almost at the surface and had an EROI of discovery of 100:1.(2). It has since declined, depending how one measures it or who one talks to, in the range of 10-15:1. As it gets deeper, harder to find, more viscous, higher sulfur content, etc, the EROI will continue to decline. A typical refining efficiency is about 10:1, so the total refined EROI of our precious liquid fuel is still between 5-10:1. This may not seem so high (compared to 100!), but how many stocks have you owned that make 500-1000%? On each iteration? This is the type of energy subsidy world society has become accustomed to.(My paucity of references for this segment gives evidence to how little concern our leadership has for the issue of net energy. Charles Hall, (with data from John S Herold and Co.) and others are working on new updated oil and gas EROI numbers - but solid energy data is either proprietary or difficult to assimilate)

WHY IS NET ENERGY IMPORTANT?

We all intuitively know the difference between net and gross - we use the concept everyday. If you make $100,000 per year in salary and the government takes 38%, your net is $62,000. If the government took 99%, it really wouldnt matter whether you made $100,000 or $1,000,000, your take home would be very small. The same concept applies to energy, and in particular, whatever energy source is most central to society. Basically, net energy matters because net energy is what we use.

"Energy gain, or EROI, varies with the quality (transformity) of a resource deposit and with the efficiency of the technology used to locate, extract, process, distribute and exploit the resource. As the ease of obtaining or using a resource declines, more energy must be devoted to these activities, causing energy gain to decline. Where an energy budget is substantially constant, allocating more resources to energy production reduces the amount of energy available for other activities. The potential impacts of such a situation on a human system include less leisure time, a lower standard of living, higher taxes, and an increase in childhood mortality. In an animal population, allocating greater effort to energy production may mean less winter fat, increased embryo resorption, lower birth weights, or the like.Tainter(3)

It is fundamentally impossible to maintain a constant level of net energy while the aggregate energy profit ratio drops. Only after the energy profit ratio and the need for new fuel related level off can net energy supplies return to the desired level (4).(This book, Beyond Oil, is 20 years old, but is probably the best book on the concepts of net energy, agriculture and society)

We are currently living in the highest energy gain era of any organism in the history of earth. Although the total amount of BTUs consumed in 2005 was higher than any year in history, world energy per capita peaked in 1979.(5)(One could argue that the plateau in net energy per capita has been maintained by a large wealth transfer from poor to rich, from future to present, and from abstract 'energy' (debt) to real consumption).

There are a finite amount of stored fossil fuels on the planet. Some of the largest, highest quality resources have already been exploited. The remaining resources are in many cases more energetically difficult to harvest, or have negative side effects (e.g climate change and coal).

"Environmental degradation is greater when the resource is of low quality and distributed but heavily used. Thus, a switch to renewable energy sources might bring, ironically, environmental damage comparable in scale to, or greater than, that caused by the use of fossil fuels." (Joseph Tainter)(2)

We already see evidence of this in some of the scaling of biofuel production in Asia

A NET ENERGY PARABLE

Net energy of corn ethanol examples and debates have been presented ad nauseum from both proponents and detractors. The redundancy is trivializing the concept. Though the ethanol debate is critically important in deciding how to deploy of our remaining fossil energy, what follows is a more benign example:

A civilization of 1000 sasquatches lives on a small distant Planet P. They require only food (energy) and water to live but also enjoy a vibrant culture with artisans, builders, and craftspeople. Sasquatches are vegetarians (as everyone knows) but do raise animals for labor help, namely Hephalumps. These animals help them harvest large hempy plants from the mountain near where they live and process them into Saspacks (the finest, sturdiest, durable backpacks in the universe). Each week (which is 10 days long, based on Planet P's sun), the sasquatch colony works very hard for five days and then has leisure time during for the next 5 days. Once a year, a ship from Planet X lands and trades luxury food items (non-caloric but tasty), medicine, comic books, and basic materials in exchange for an agreed upon cargo of Saspacks.

This societies only source of energy(calories) is Waybread, which is a highly energy dense cake made with Spice, water, and the meat from the Mongo nut, which grows in an enormous grove 25 miles from the sasquatch community. Once a Ten-Day, a troupe of the strongest 300 sasquatches traverses 25 miles to the Mongo nut groves, fills up their packs with nuts, and returns home with their energy bounty. It is a one day grueling journey across the Black Plains and through the Black Swamp but they make a ritual of it, telling stories and laughing most of the way until they arrive late at night. They spend a second day climbing trees and picking Mongo nuts, laughing at the colorful monkeys that play in the Mongo trees as well as picking some flowers to bring home to their wives and girlfriends. On the third day they leave at the crack of dawn and are home by nightfall. These same 300 sasquatches then spend two more days, cracking, pounding and combining ingredients together with the nuts to make Waybread; enough for the entire community for the next Ten-Day. All these sasquatches do no other work or leisure on the days they are procuring energy for the tribe. In return, they receive exalted status as the tribes energy providers, and a five day rest.

Since Sasquatches are freakin' huge, each member of their society consumes 4 m-cals a day. They really only require 3 m-cals to survive, but the extra makes them fat and hearty and also contributes to general gastronomic pleasure (sasquatches do not like to feel peckish). Hephalumps are even bigger and the 100 strong herd each requires 8 mcals per day of Waybread to survive and function. Although Waybread is highly nutritious, it is also highly perishable, and must be consumed within one Ten-Day, after which time it gets wormy, and gross.

During the five-day ritual of energy harvesting and preparation, 600 other tribal members are busy harvesting fiber from the mountain, and weaving and stitching it into Saspacks. The remaining 100 bigfoots, mostly youngsters, clean and maintain the village, manage the water supply from the river, and comb the hillsides for Spice. At the end of the fifth day, a feeling of joy emerges in the community as the tribe can look forward to relaxing, dancing and sleeping for five straight days, with plenty of Waybread for everyone. This routine has been going on for as long as any sasquatch can remember. None of them could imagine anything otherwise.

We can determine the energy gain (or net energy) of this society based on the above information. First let's look at the energy output:

Each of the 1000 sasquatches eats 4 mcals per day and there are 10 days per week on their planet. This equates to 40,000 mcals energy consumption per Ten-Day. Each of their herd of 100 Hephalumps requires 8 mcals per day (8,000 mcals per Ten-Day) Therefore the Mongo nut energy source provides them with a flow of energy of 48,000 mcals per Ten-Day. This is their energy output, which is entirely consumed.

How much energy does this society spend in order to get the 48,000 mcals? Well, 300 sasquatches work/travel for three days to acquire the Mongo nuts and then spend two days refining it into edible quality. They have to eat for nourishment during this time otherwise they would not have the strength to do work. Their caloric input (from the prior week's waybread) is 300 sasquatches times 5 days times 4mcals equals 6000mcals.

The energy gain for this society is 48,000 mcals less 6,000 mcals equals 42,000 mcals per ten-day.

The EROI is 48,000mcals/6,000mcals =8:1. The net energy is EROI-1 or 7:1. (Remember, EROI is FOR one and net energy is TO one.) For every unit of energy spent in energy harvesting/refining, 8 are produced. Since they used one unit to produce 8, 7 are left over for other areas of society. (Of the 48,000 mcals of energy available to their society, 6,000 is used for energy production, 12,000 is used to make Saspacks, 2,000 used for cleaning and water procurement, 8,000 to feed the Hephalumps and 20,000 to sustain the tribe during their 5 days of hedonistic leisure.) Sidenote -even though there is a 8:1 EROI, 30% of the tribes members contribute to energy procurement.

One day, the 300 energy procurers arrive at the Mongo grove and find many of the colorful monkeys lying dead on the ground. They were so disturbed that they carried 2 of the carcasses home to show the shaman. They also discovered that the Mongo nuts were no longer as easily reachable from the ground and they had to go either deeper into the forest, or climb higher up the trees to fill their packs with the largest ones. This ended up taking a whole extra day.

After returning home a day late, the community was in a panic. They would have to spend a day out of their Five-Day to finish the procurement of food! And the sight of the dead, dark colored monkeys made many sasquatches cry. It was decided to call an emergency Council, to determine what might be done about the turn of events. Many wise and respected sasquatches voiced their opinions. They were saddened by the dead monkeys, but they were more concerned about the lack of easy to find Mongo nuts - the implications being the 300 energy workers might have to work MORE than 5 days per Ten-Day. One of the senior males suggested "We could save a little time by not stopping to pick and bring home flowers which aren't really needed for our energy supply". A matriarchal sasquatch immediately stood up and chastised "Zeke-Stinky-foot, you come home without flowers and you'll see how much they are needed, Husband-mine!". There was a vote and it was decided to continue to pick and bring home flowers.

During much arguing and debating, the shaman entered the pavilion and everyone quieted down. He exclaimed "Colorful Monkey-friends die from Black poisoning" A sharp intake of breath from the Council-members. "Our energy providers feet put Black Desert and Black Swamp on Mongo trees while they pick nuts. Colorful-monkey friends get on paws then in mouth then die." The Council went into an uproar - Black poisoning! Because of our energy procuring! How awful! Yet what can we do? - We need the Mongo nuts to survive and have energy to work and sing! And if we go around the Black Desert and Black Swamp it will take an extra day in both directions!!" The sasquatches were very upset, and spent most of their Five-Day arguing and trying to make a new plan, where none had ever been needed before. It was decided by the Council to have the 300 workers spend an extra day at the groves to fill up their packs. The Shamans comment about the Black Desert being carried to the trees, and killing monkeys was only talked about by a few, and drowned out by the sasquatch leaders who really wanted at least 4 days of leisure and 4mcals per day. It was also decided to send 100 of the 600 saspack workers on exploratory missions, something that hadn't been done in generations, to see what was beyond a 25 mile radius of their community.

These plans worked out reasonably well and gradually the sasquatch colony adjusted. After all, they still had the same amount of food and energy, even though they had to work slightly harder for it, and produce a few less Saspacks. At the end of each Ten-Day the sasquatches were not quite as well rested, but were happy in their resolve to work a little harder to get energy for the tribe. (The Hephalumps did not notice any of this, and continued to chew their 8,000 mcal of Waybread per week.)

The phenomenon of `best-first' apparently applies to Mongo nuts as well as oil. We can now calculate an updated net energy for the sasquatch society. The energy production was the same, at 48,000 mcal per Ten-Day. But the 300 sasquatch energy team now worked 6 days per week requiring 4mcal per day or 7,200 mcal. Also, 100 workers spent 2 days per week (on average) exploring and looking for other Mongo nut sites. From a societal perspective, this `energy exploration' expenditure of 100*4*2=800 mcals should be included (somewhere) in any net energy calculations even though it didn't directly result (yet) in energy production.

The updated EROI formula is:
Energy output = 48,000 mcal/Energy input =8,000 mcal = EROI of 6:1 (net energy of 5:1)

Now of the 48,000 mcal of production, 8,000 is used for energy procuring, 11,200 is used for industry (Saspacks), 2000 for village maintenance, 8,000 for Hephalump food and 18,800 for leisure. Everyone in the sasquatch civilization still consumed the same amount of energy as before, but societies mix of labor allocation and free time had shifted.

***Sidebar of interest: We also now have information to calculate a more advanced (thorough) form of EROI, one that includes co-products and externalities. Flowers have value to sasquatch society and as such get a `co-product' credit in the EROI calculation. (much like dry distiller grains in the ethanol calculation) Since they are an additional output, we can reduce the amount of energy allocated to getting the Mongo nuts, as some of the sasquatch caloric expenditure is now considered necessary for getting flowers. How we allocate this is a debated but relevant question. We could take the market price of the two products (sasquatch society has none) or allocate by mass( the flowers have 50% of the mass of the Mongo nuts) or by volume (they are very light - only 10% the weight of nuts).

Allocating by mass would increase the EROI quite a bit:

Energy output = 48,000 mcal Energy input =4,000 mcal (4,000 allocated to flowers) = EROI of 12:1 (Net energy of 11:1)

Allocating by weight would increase the EROI slightly:
Energy output = 48,000 mcal /Energy input = 7,200 mcal (800 allocated to flowers) =EROI of 6.66:1 (Net energy of 5.66:1)

Our market system (in my opinion) underestimates the long term value of energy to society and net energy calculations that give so much `energy credit' to things like Dry Distiller Grains, thus overestimate the true energy gain (or underestimate the energy loss).

Regarding externalities, it is difficult to put an energy cost on dead monkeys. However, the poisoning was clearly a direct result of the sasquatches energy harvesting techniques and to exclude it from an energy analysis would not be holistic. Modern EROI analysis is just starting to value externalities as costs (see Patzek and Pimental regarding soil mining and Life Cycle analysis of GHG emissions) Ecological economics attempts to value things that humans need and value but are considered `free' in the market system. Quite possibly, the limiting factor of large scale ethanol production, even cellulosic, is the degradation of soil and assumption of continued ease and availability of irrigation.

Since sasquatches are a peaceful and conscientious race, lets arbitrarily allocate a high energy cost to the biodiversity loss to their culture of 8,000 mcals. The EROI would then be:
Energy output = 40,000 mcal (8,000 were subtracted) / 8,000 mcal energy input
=EROI of 5:1 (net energy of 4:1)

Continuing with our story:

The sasquatches situation, largely beyond their control, deteriorated further. The Mongo nut supply, while still enormous, was becoming more thinly distributed. Also, the nuts, which once averaged 3 lbs were now mostly 1-2 lbs. It took the sasquatches much more time and effort to pick and organize them. It also took more time to process them into Waybread, as the shell to nut ratio had increased substantially. All in all, it took an additional 100 sasquatches (400 total) a total of 7 days to harvest and process the Waybread. They were not beginning to get restive.

One day, while the stressed sasquatch community was hard at work on what was normally their 7th day (2nd of leisure), a troupe of youngsters came running full out into the village "We are saved! We are saved! - We found a new Mongo nut grove with huge nuts and plenty of them!! We'll soon be able to go back to our old routine of dancing and reading comic books! For a Five-Day! These nuts are huge!"

A Council was hastily convened where the youths were eagerly bombarded with questions: "How big was the grove? Were there colorful monkeys? Would you like some water? Have you met my daughter Fern-Blossom?" An old silver-back sasquatch, one of the tribal leaders, stood up and quietly asked "Sons, how far is this grove?" One of the scouts replied "Sir, its 120 miles on the other side of the mountain, but an easy walk, with no Black Swamp or Desert". The leader nodded: "That is 5 days in each direction. If we send our energy workers that far, there will not be enough time for them to process the Waybread upon their return." He paused, "However, our Mongo nuts close to the village are getting smaller. I think we should go harvest this new, bigger energy source you have discovered. We will have to take more of our Saspack workers and our village cleaners too. But you are right, you have saved us."

When everything was sorted out, the sasquatches had to organize 2 energy procurement teams of 375 sasquatches each. One team brought water from the village and met the other team halfway and then returned with the large Mongo nuts to process them. These teams traded off in their duties but worked 8 days total out of every Ten-Day. This left 200 sasquatches to work on the saspacks, and it was decided, to be fair and because they were behind contract, that they also work an eight-day. There were only 50 of the tribe left to work on cleaning, and basic village maintenance. The community was amazed that so much! of their time was spent making Waybread, just to spend it on making more Waybread - very little singing and relaxation time anymore. After a few months, the tribal leader, at a somber Council meeting, announced that everyone would have to cut back, and strict rationing of daily consumption to 3 mcals per sasquatch would be enforced.

Because of the reduction in Saspack labor time, the Hephalumps weren't all needed and some started to roam the village. A large controversy erupted when one of the energy workers, strained from a long ten-day on the road, hit a hephalump on the head and killed it. He wanted to eat it but didn't know how.

The energy gain of this society continued to decrease. The energy output of 48,000 mcal (before the rationing), had an energy input of 750 sasquatches times 4 mcal times 8 days = 24,000 mcals.

The EROI was 48,000 / 24,000 =2:1 (Net energy of 1).
A large portion (50%) of this societies efforts were now allocated to energy procurement. Of the total 48,000 mcals procured, 24,000 was from energy procurement, 8,000 was for their livestock, only (200*8*4mcal) =4,800 mcal devoted to Saspack production, and 1,200 to maintain the village and procure water and 10,000 mcals for leisure and art.

A further problem, (for which I dont plan to attempt the math) was that WATER, not energy was now a limiting factor in the energy harvesting process. Water was much heavier to carry than Waybread so a cache had to be set up midway between the water source and the Mongo nut source. The Energy Return on Energy Invested stood steady at 2:1, but the Energy Return on WATER Invested, was declining dramatically.

After the tribal decision to ration consumption, the energy gain of society upticked. Since each sasquatch only consumed 3 mcals, (and many noticed new clarity of thinking and vitality after initial grumbling), the energy production requirements tapered off a bit:

The tribe still procured the same amount of Waybread (the extra was allocated to the following weeks Mongo picking team). The energy input was now only 750 *3mcal *8days = 18,000 Mcals. Because of their belt tightening (or efficiency) the societal EROI increased to 48,000/18,000 = 2.66 (net energy 1.66).Note: the EROI of energy procuring didnt change, but the societal energy gain, from a Tainter-like perspective, did increase.

At year end, the spaceship landed from Planet X. (There were 14 female sasquatches, and one male, waiting at the landing port, hoping to be rescued.) The alien trader strode down the ships conveyor and frowned when he saw the somewhat disheveled sasquatch community. There were Hephalumps everywhere (a delicacy on his planet), huts and sidewalks were in disrepair, and the tribe looked thin.

He was greeted by the tribal leader who sheepishly stated "Noble trader, our energy supplies have dwindled and we had to spend extra time harvesting a new energy source so only had time to make 3,200 Saspacks, not the 6,000 per our agreement."

The alien snorted, "Silly sasquatches - your world, though small, is FULL of energy - what you call the Black Swamp is also known as crude oil and what you call Black Desert is called coal-both of these substances have way way more energy than your precious Mongo nuts. Since you are good customers, I will give you your materials and ½ the medicine but withhold the tasty treats and comic books until you can make more Saspacks. If you like, I will bring machinery to your planet and help you to harness your Black Swamp, in return for great riches" The community was saddened and confused. How could the Black Desert be strong energy? It was poison. They held an immediate Council and concluded that they could do without the comic books, materials and candy. The local shaman could find his own medicine, and they would continue harvesting Mongo nuts, but would further divide the labor among the tribe and produce Saspacks no more. They also didn't need the Hephalumps anymore and would lead them to the Mongo groves and leave them free next Ten-Day. They waved goodbye to the galactic trader for the last time.

The sasquatches were transitioning from a high to a low gain energy system. By removing the Hephalumps and the Saspack industry, which brought them niceties that they didn't really need, they now only had to procure 30,000 mcals per ten-day. The energy input was still 750 *3mcal*8days = 18,000 Mcals.

The final EROI in our example is 30,000 / 18,000 = 1.66:1 (Net energy of .66). While lower, the community now had reorganized in such a way that 18,000 mcal went to energy procurement and 12,000 were left for leisure and dancing and singing (40% of all energy).

CONCLUSIONS

Sasquatch civilization underwent a decline in net energy. The results were less industry and less free time, as a larger effort had to be made to procure essential food. Eventually, they partially offset this loss in energy gain, by jettisoning certain aspects of their culture that were energy intensive yet did not really provide the satisfaction that it cost. The situation of the Sasquatches is not that different from our own. Our assets are human ingenuity, 1.2 trillion barrels of oil, 179.8 trillion cubic meters of natural gas, and 909,064 million tones of coal (of various qualities)(source BP), and the various renewable flows generated from the planet. Our liabilities are a large population, the seemingly unquenchable human desire for more, a growing realization that we have in fact tapped the 'best-first' energy reserves, and ecosystems that are nearing the limits of their resilience to human extraction and waste absorption.

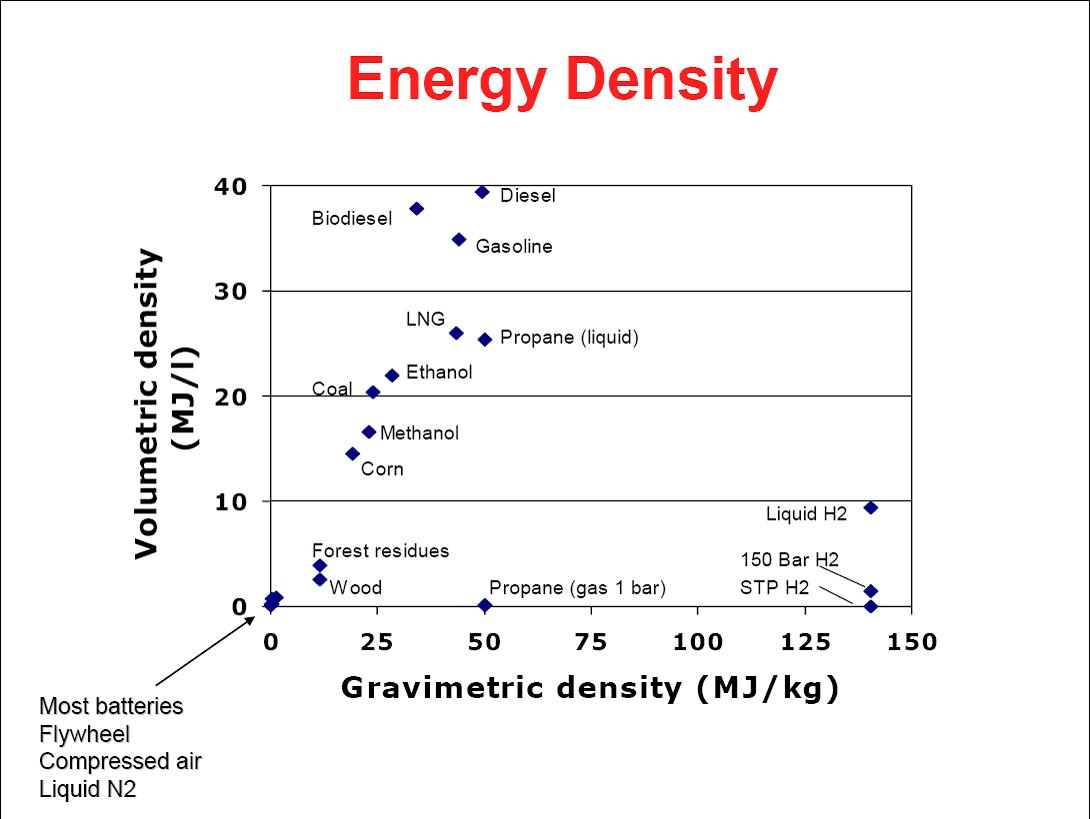
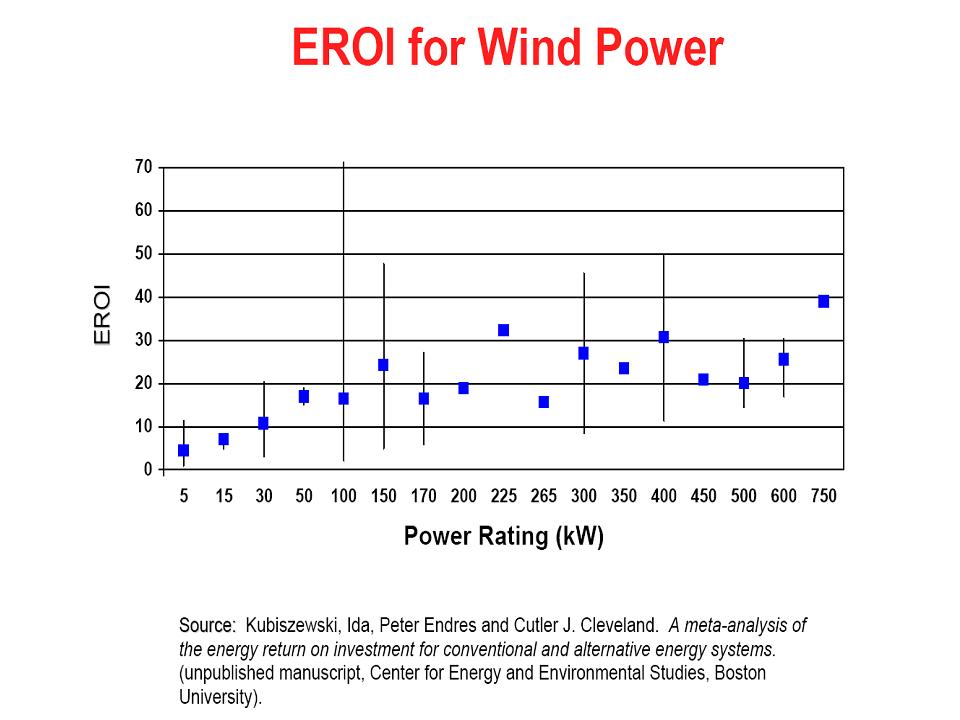
Our civilization is organized around high energy gain infrastructure - low gain sources, possibly even as low as 5:1 may not have the energy density required to power our liquid fuel intensive society. As can be seen by the below graphic, shopping centers and skyscrapers are part of a high energy infrastructure. Renewable flows, at least thus far do not match up in energy gain. Large scale wind has a higher EROI than oil, but cannot (as of yet), power our planes, trains and automobiles.

(Graphic from Cutler Clevelands EROI powerpoint.)

The corn ethanol and even the cellulosic ethanol debates typically miss a larger point. Much mental effort is spent debating whether the energy balance is slightly positive or slightly negative while society runs on an energy gain significantly higher than any liquid fuel alternative. When we hit $150 oil, there won’t be too many parents buying their kids a new GI Joe with the Kung Fu grip toy. At the same time, energy companies will need more and more employees to man wildcats and oil rigs and install solar panels. Though we might not be thinking in these terms at the time, the lack of energy gain (or lower net energy) will be manifesting itself in resources taken away from marginal areas of society (toy companies, hot tubs, hemorrhoid cream, Snausages, poker chips, etc) into energy producing and distributing sectors.

THE BOTTOM LINE:

1) Net energy is more important from a relative basis than absolute. A 3:1 EROI doesn't tell us much unless we know how that compares to what an organism/society has been built on/used to. A 2:1 EROI would have made stone age villagers incredibly rich. A 5:1 EROI may not be enough to power our society. (e.g. as fossil fuels get more expensive they will collapse the economy and no real recovery will ever happen as the high energy gain outputs are already gone)

2) Energy reserves are not as important as energy flow rates. We could have a billion mongo nut trees, but all that matters is the maximum flow that society is able to harvest in real time. (This obviously applies to oil as well)

3) Energy quality depends on the context. High BTU substances, like oil or coal, are clearly very useful to our society, but may not be to others. (the sasquatch colony valued and used Waybread, not oil)

4) Liebigs law of the minimum applies to an energy portfolio. Wind has a high EROI, but our system infrastructure relies on liquid fuels. The net energy of the weakest link matters more than the overall net energy of society. (Adding high EROI wind capacity while net energy of oil dwindles does not solve the problem, unless the energy mix changes from liquid fuels to electricity)

5) Using different boundaries in net energy analysis will lead to different conclusions. A society running at 5:1 EROI would be happy to develop a scalable technology with an 8:1 EROI, however, after environmental externalities are included, it might only be a 3:1 technology. (Coal-to-liquids and climate change comes to mind) The difficulties lie in making meaningful comparisons and valuing important life functions not priced in the market system.

6) Rather than pursuing the highest and most promising energy technologies, it might be prudent to pursue ones that are certain, and meet the net energy decline half-way by reducing energy footprints. As we decline in aggregate societal energy surplus, a great deal of remaining energy is going to be wasted, ostensibly going after 'more oil and gas', which will likely be unprofitable both monetarily and from energy perspective.

7) Since evolution has favored organisms that have the highest energy output energy input ratios, it will be a cognitive challenge for us (as organisms) to willingly reduce the numerator.

8) Consumption, in the sasquatch example, continued very high until late in the game, and was subsidized from borrowing from other aspects of society. Lack of energy gain was a phantom concept until the situation was much deteriorated. Similarly, in our current fiat based civilization, we might 'replace' the lower energy gain by printing money or relaxing financial requirements, but these measures will not be based on anything biophysical and make the eventual crash much steeper. In the end, it's not about how much energy we have but how much societies can afford via real inputs.


Our collective task will be to improve our net (total cost) energy from renewables while changing the infrastructure of society to best match what our long term sustainable energy gain can be.

-thelastsasquatch (a.k.a. nate hagens)


(1) Net Energy from the Extraction of Oil and Gas in the United States. Cutler Cleveland, Boston University

(2)Hydrocarbons and the Evolution of Human Culture, Hall et al. Nature Novermber 20, 2003

(3)Resource Transitions and Energy Gain, Tainter et al. Conservation Ecology 2003

(4) Beyond Oil: The Threat to Food and Fuel in the Coming Decades, Gever et al, 1986 Ballinger Publishing

(5) The Olduvai Theory: Energy, Population and Civilization, Richard C Duncan, The Social Contract Winter 2005-2006

Wednesday, January 6, 2010

Mike Ruppert: The world is falling apart

Mike on majas värske artikliga, emotsionaalselt dramaatiline nagu vaja.

JAN 3, 2010 -- As I write, the world is falling apart. Military forces from all major powers are flooding the Gulf of Aden, using piracy and terrorism as a pretext. This is all jockeying in anticipation of a major, and possibly total, war in and around the Persian Gulf -- where 60% of the planet's known oil is. Pakistan is imploding. Within days it will face a "worst possible" energy crisis and, according to Pakistani news sources, trigger massive civil unrest. Pakistan has failed. An Israeli and/or U.S. attack on Iran is now, no longer unthinkable. Just recently, Israel recalled all its ambassadors and charges d'affaires simultaneously for what (sure looked to me) was an emergency huddle. Major power shortages are crippling nations from the Phillipines, to Vietnam, to India, throughout the Caspian and especially Pakistan. Cities in many countries (including the USnd Britain) are selectively turning out streetlights that will never come back on because they can't afford the cost. The world is starting to shut down.

Sovereign default is a threat throughout Europe and especially in Greece and the United Kingdom. There are signs that the U.S. economy has started to implode. I will join my good friend, the brilliant James Howard Kunstler, in predicting a DOW at 4,000 in 2010.

President Obama has just ordered massive governmental preparation for a biowarfare attack. Something evil this way comes, and it will be worse than 9-11. Those who have followed me regularly over the years know that I have never gotten excited about any of a score of rumors of another attack. I was the last to get excited because I trusted the map we were making. It proved accurate.

It still is and I am scared sh***ess. But I am not panicking. I'm trusting the map. We made it together. We're on this ride together.

With the movie Collapse doing well and the book selling strongly I appreciate the risk I'm taking with my credibility, and that I am inviting attacks for issuing this statement. It has been estimated that over a decade my predictions have been 80 per cent accurate. (I never kept count.) I pray to God that this is one of those 20 per cent that I get wrong. To all of you who I love and to whom I owe so much, I recommend that you make a small investment in potassium iodide tablets for yourself and your family. It's time to start running faster than the other campers.

And with all of that you should hear the songs the New White Trash are writing and recording. You will very soon. I am so proud to be a part of this band. Music will make the birth of the new paradigm easier to take. I've been listening to Taj Mahal all day.

EROEI

EROEIst ja languse loogikast. Artikkel siit.

Diminishing Returns of Fossil Fuel Energy Invested

When investing money, everyone calculates how profitable that is, either in interest paid from bonds, dividends received from shares or cash flows from a business. But for all these investments to be successful we need energy. So how about energy supply projects: how much energy do they return for the energy invested?

This is the 4th post in a series on the best slides of the ASPO 2009 conference.http://www.aspousa.org/index.php/2009/11/2009-conference-proceedings/ There are 3 slide shows on the topic of energy returned on energy invested (EROEI):

(1) Hannes Kunz: Economic Scenarios for an Age of Declining EROIs
http://aspo-usa.com/2009presentations/Hannes_Kunz_Oct_11_2009.pdf
Institute for Integrated Economic Research http://www.iier.ch

(2) David Murphy: Recent Applications of Energy Return on Investment
http://aspo-usa.com/2009presentations/David_Murphy_Oct_11_2009.pdf
Web site: http://netenergy.theoildrum.com

(3) Jeff Vail: The Renewables Gap
http://aspo-usa.com/2009presentations/Jeff_Vail_Oct_11_2009.pdf
Home page: http://jeffvail.net

This is the general definition, a dimensionless factor which should be greater than 1:

eroei

http://en.wikipedia.org/wiki/EROEI

As an introduction let’s look how much energy is needed to produce oil itself. The latest work on this is here:

(4) A Preliminary Investigation of Energy Return on Energy Investment for Global Oil and Gas Production. July 2009
eroei_oil_gas_hall_et_al Nathan Gagnon, Charles A.S. Hall and Lysle Brinker
http://www.mdpi.com/1996-1073/2/3/490/pdf

The current EROEI is around 20, that is 1 unit energy invested yields 20 units of energy gained. But that figure was almost 35 just a couple of years ago. The graph shows that the energy efficiency of producing oil has peaked around 1999 and is now in decline. The reason for this is that out of 70 mb/d of crude oil production around 55 mb/d come from fields which are past their production peak (see http://www.crudeoilpeak.com/?p=355) and that means enhanced oil recovery (EOR) must be used to reduce decline rates. This EOR of course requires energy: heat for steam injection, pumping increasing amounts of water for maintaining reservoir pressure or building pipelines for gas injection. As an example, this article http://www.crudeoilpeak.com/?p=812 shows Saudi Arabia’s latest efforts in producing oil in Khurais. There is a lot of embedded energy in those oil/gas/water separation plants and the operation of these facilities also needs energy. The increasing number of offshore fields is also a reason for increased energy input requirements. Hannes Kunz (1) showed a nice slide to illustrate this:

eroi_oil_decreasing

eroei_oil_gas_trend_hall_et_al

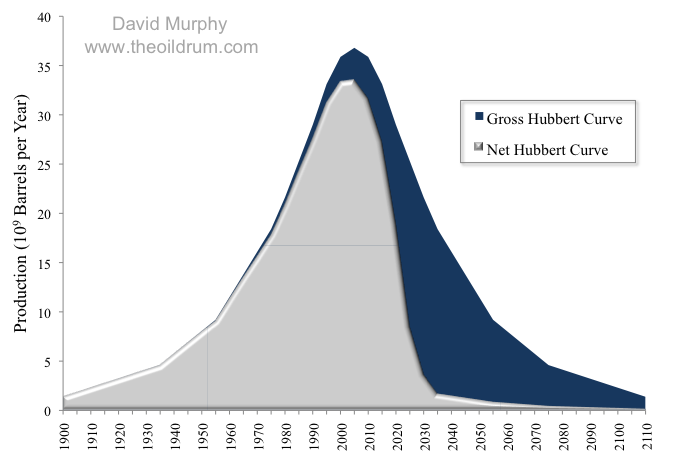
What could be the trends into the future? Figure 2 from (4) shows trends are declining, but it is not clear whether the future trend is linear or not. For a more detailed discussion see here: http://netenergy.theoildrum.com/node/5600#more But there will be a further decline and that is the important point. It will deform the Hubbert Curve to a net Hubbert curve as shown in this graph: http://www.theoildrum.com/files/Net%20Hubbert_6.png

An EROI of 1 means of course that for the purpose of producing oil as an energy source this is no longer energy profitable. But the minimum EROEIs are much higher than the theoretical limit of 1.

(a) EROEImin = 3 for transport only

(b) EROEImin= 8-10 to support society

“If the decline in EROI continues, then the amount of energy that will be available to sustain and grow the economy, both nationally and worldwide, will decline as well. The recent paper by Hall et al. ( (5) http://www.mdpi.com/1996-1073/2/1/25) on the minimum EROI for society indicates that society, even at its most basic level, cannot function on an EROI at the wellhead of less than about 3:1, and that considerably more than that would be required for the full suite of goods and services (such as medical care and education) that we have come to expect.”

eroi_energydelivered

David (2) gives more details on the EROEI for petrol, diesel and ethanol. The above paper (5) adds to the usual EROImm (at the mine mouth or farm gate) following definitions:

Energy returned at the point of use:

eroei_pou

and energy returned including the energy cost of infrastructure:

eroei_ext

david_murphy_implication_low_eroi_fuels

From (2): as we are going towards lower EROIs, society runs into a net energy cliff.

Hannes Kunz (1) shows the higher the speed the higher the energy costs :

eroei_transport

In order to avoid the net energy cliff we have to invest energy to build up genuinely renewable energy systems. Jeff Vail (3) warns of a renewable gap when replacing declining oil production

jeff_vail_renewables_gap

In http://www.jeffvail.net/labels/Renewables%20Hump.html Jeff calculates as follows:

1 million barrels * 1700 KWh /barrel / 24 h = 70.83 GW installed (heat equivalent)[1]

Assuming a net 5% decline in oil production (4.4 mb/d) that’s globally

4.4 * 30 years [energy return period] * 70.83 GW / 20 [EROI] = 467 GW installed

See data point on light blue curve for year 2. This curve declines because 5% from a declining oil production base is less in absolute terms every year.

This is a gigantic job on top of replacing/retrofitting existing coal fired power plants.

Let’s do this for Australian oil consumption of 870 kb/d and also a 5% decline (assuming functioning oil markets and no limits to the fungibility of oil, i.e. free exports and imports)

0.87 * 0.05 * 30 * 70.83 / 20 = 4.6 GW EVERY YEAR

Has anyone geared up industrial capacities to do this job? I’ll explore this in more detail in a later post. This calculation serves only the purpose of showing the magnitude of the task.

Conclusion:

There are 3 energy related tasks ahead:

(A) Replace coal fired power plants with renewable or low carbon energy systems
(B) Offset declining oil production with a renewable primary energy source (electricity and hydrogen are NOT energy sources, they are energy carriers)
(C) Set aside energy (=save from consumptive use of energy) to build up the new energy systems for A and B

In Australia:

Task (A) is about 40 GW over, say, 40 years, that is 1 GW/year – assuming there is no abrupt climate change which forces us to do the conversion faster, e.g. in 20 years. Task (B) is therefore 2-4 times bigger than that.

If we are not immediately doing (C) we’ll get stuck in jobs (A) and (B)

What are the practical policy implications?

(A) Do not add new energy hungry structures. But what does the NSW government plan? Yes, a mini Dubai in Darling Harbour. The steel in those skyscrapers (embedded oil for mining and CO2 emissions from coking coal!) should be used for e.g. building up wind farms to produce electricity for existing skyscrapers.

barangaroo_grand_slam

Neither do the architects seem to have heard about sea level rises (see external links).

http://www.smh.com.au/national/grand-slam-for-barangaroos-grand-plan-harbour-makeover-looks-like-worst-of-dubai-20091221-la26.html

Who will be fooled by this spin: Barangaroo to be carbon neutral

http://www.smh.com.au/environment/barangaroo-to-be-carbon-neutral-20091101-hrl5.html

(B) Do not build any more oil consuming tollways. But what does the NSW government plan? A widening of the M2:

m2_additional_lanes

http://buildingsydneymotorways.com.au/m2-a-lane-cove-tunnel-corridor/m2/planned-improvements

m5_corridor_expansion

http://buildingsydneymotorways.com.au/m5-corridor/m5-corridor-expansion

And an extension of the M5 because the air traffic is assumed to double. A complete disconnect to reality.

Download this article as PDF file: Diminishing Returns of Fossil Fuel Energy Invested [1.74 MB]

Economics and Limits to Growth: What's Sustainable?

Dr. Dennis Meadows esines Population Institute`is teemal kasvu piirid. Oil Drummi mehed olid kohal, tegid ettekandest lühikokkuvõtte ja samuti on võimalik kuulata/vaadata seda esinemist.


Slide 1

The reason I [Dr. Meadows] am giving this talk is because I think that there is the possibility of positive change.

Much of the way that we conduct ourselves is based on habit. For example, we get into the habit of crossing our arms with our right hand (or left hand) on top. It is not that putting the right hand or left hand on top is better or worse. We have just developed a habit of crossing our arms in a particular way.

If we are going to solve the population problem, we need to learn new habits. I am hopeful that like learning to cross our arms in a different way, we can inspire people to learn new habits that will limit population growth--something that is needed with finite resources.

My [Dr. Meadows'] views regarding what is sustainable are different now than they were 40 years ago. At that time, I worked with others at Massachusetts Institute of Technology to build a simple computer model that might offer some insight into the impact of limits to growth. We did not expect the model to be predictive--only that the scenarios might provide a rough boundaries regarding what might happen in the future.

In our reference scenario in 1972, we expected growth to continue for 40 to 80 more years. The major difference I see in looking at the situation now is that things seem to be developing more rapidly than we expected then.


Slide 2

Let's start by looking at our reference scenario. The red line shows where we were when the model was first developed. I have blocked out the fourth quadrant of the chart, because the world situation is likely to be so different from the situation we modeled that the model is likely to be totally irrelevant. The area shaded in light blue represents the time period that might possibility be changed by the policies we implement today.


Slide 3

In 1972, we expected another 40 to 80 years of growth in the various scenarios. While some of the scenarios we looked at ended in orderly decline, most of the scenarios we modeled ended in collapse. This likely outcome was later confirmed by William Catton in his book Overshoot.

You will note I say that technology may delay the end of growth a few years, but it does not avoid the end of growth or the decline. I have worked in science and technology, and I have a scientific degree, so I am not saying this because I am unaware of what technology can do. When we put together models using phenomenally optimistic assumptions, it just moved the decline date back a few years.

Social changes are essential for a better outcome. Take population for example. There are two ways population can decreased:

1. The birth rate can go down, or
2. The death rate can go up.

A key factor to understand is that what are normally considered problems today--for example, climate change, energy shortages, and erosion, aren't really problems. Instead, they are symptoms of attempted infinite growth in a finite world.

In some ways, the situation is like if you have a friend who has cancer, and because of the cancer he has a headache. It is not nice to have a headache, so you give your friend pain relievers, but you don't imagine you have cured the problem. The problem is cancer, and until you deal with the problem, there will be one or another manifestation, such as a head ache.

We talk a lot about climate change today. I predict that in three or four years, we won't be talking about climate change. We will be talking about energy scarcity or food shortages or declining water supplies. This will occur not because we have dealt with climate, but because it is one of a large family of pressures which are going to mount until finally physical growth stops.


Slide 4

[I do not believe that Dr. Meadows spoke directly about this slide, but I thought it was important for completeness.]


Slide 5

World population has been rising rapidly, and in our models, continues to rise.


Slide 7

World metal use is also rapidly increasing.


Slide 9

We have now reached overshoot. According to Wackernagel's analysis, we passed global capacity in 1980, eight years after our book was published. We are now about 40% above carrying capacity, according to his analysis.

In the early days, we had only models to tell us we were beyond carrying capacity. Now, we can look at the newspapers and get confirmation of the fact.


Slide 10

Kevin Noone published this image in Nature showing various areas where overshoot may manifest itself. Except for ozone, we are not making much progress in keeping physical stresses in limits. Some sectors appear not to have problems, but that is only because we do not have the situations quantified.


Slide 11

It was astonishing to me in 1972 that people could start from the assumption that there are no limits. It has been even more amazing to see the evolution to this thinking. Initially, the assumption was that people were just uninformed. The assumption was that if we can manage to give them the facts, they will change their opinion, and fall into line. Nothing I have seen in 40 years gives me support for that opinion. If you marshall enough facts to disprove an objection, then the critics will just find another objection. There are an infinite number of objections, so you are never going to come to the end of the process.

The above slide shows the sequence of objections. Now that it is clear that markets will not fix the situation, the belief is that technology will be the solution. Technology doesn't deal well with limits either. There are thermodynamic proofs of this.

Let me discuss some key assumptions in our model. William Catton mentions that there are three different ways we use space--one for extraction; one for activity; and one for basically dumping stuff. The first and third of these have costs associated with them.


Slide 12

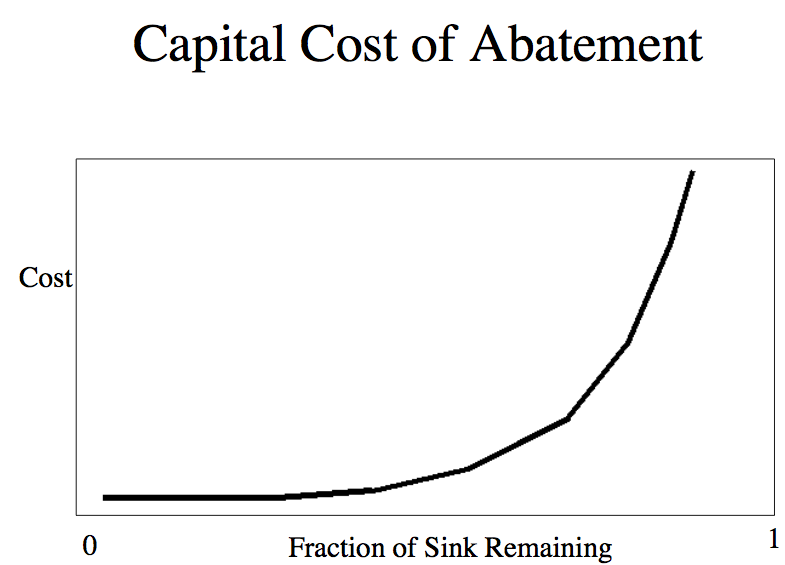
This is a generic curve, but I could show you empirically based versions of this curve for particular reserves. When you have 100% of a given resource, you can start to use it up, and you don't perceive any particular cost increase. It is only when you get past maybe 50%, 60% depletion that you start to see a radical rises in cost of extraction. We don't have time here, but I could explain why it behaves that way, and the reasons are not ones that can be changed by technology. Technology can shift the curve a little bit, but it can't alter the fact that well before you get to zero resource, the cost will become infinite.


Slide 13

And there is an analogous curve for dumps, where we try to put stuff. As the fraction of the sink is slowly occupied to a greater and greater extent, the cost of dealing with the consequences of production goes up rapidly.


Slide 14

Here is one particular example of the effect of these curves. It is the declining return on investment of energy. We built this country with energy that gave 70:1 to 100:1 energy payback. With domestic resources, we are now down to 10:1, 15:1 or 20:1 energy paybacks. You can see the trends are moving in a way which mean that well before the middle of the century, we will be dealing with energy resources that hardly break even. What you can do with 100:1 payback is enormously different than what you can do with a system that is generating only 2:1 or 3:1 payback. It is just that in the case of fossil fuels, we have used up many of the resources.

In our book, we describe the consequences of declining energy return. I won't get into great detail here, except to point out a couple of important features of our model.


Slide 15

Industrial growth occurs because of the positive feedback loop that occurs, depicted on the above chart. More capital gives you more output; more output permits more investment; and more investment lets you build up your capital stock. As long as investment exceeds depreciation, you have growth--exponential growth, and rapid rates of increase. Depending on how equitable society is, people, at least some people, get richer.

However, as we start to draw down our resources and fill up our sinks, more and more of the capital has to be drawn off to provide for the other needs. Eventually, you get to the point where you can't sustain production around the industrial capital loop sufficiently to sustain growth.

In our world model, it is the failure of model to produce enough output for capital reinvestment that tips you over into decline. We are moving now into that period.


Slide 16

Some people now looking at our curves would imagine that the periods of greatest stress would be after the peak--once the declines have set in. I don't think that is true. Right now, around the globe, we (that is corporate, political, and religious leaders) are working as hard as we can to sustain growth. For growth to stop, negative pressure have to mount until they are strong enough to offset our positive pressures. That's the period that we are in now. So I anticipate the big stresses are the ones we are going to encounter over the next couple of decades.


Slide 17

Let me give one very quick example in the two minutes that remain. Take CO2 concentration. Here again, we published this in 1972. You can see the red line and notice how quickly things accelerated after our book came out. No causal relationship there, but, on the other hand, it is pretty clear that no one paid any attention either. [Note by Gail: I wonder if the shift to debt based financing in this period helped "goose" growth.]

Why is it doing this? Everyone in the world wants greenhouse gasses to go down, but, by and large, they keep going up. Not only in the United States, which didn't sign the Kyoto Accord, but in all of the countries that did sign the Kyoto Accord.


Slide 18

Well, here we see the crucial role of population. The chart shows CO2 emissions as a function of four factors:

1. Number of people.
2. Number of units of capital per person, which is a surrogate for living standards.
3. The amount of energy required to build and operate that capital.
4. The fraction of that energy that comes from non-fossil sources.

So far, our concern about climate change had manifested itself through efforts to improve efficiency and to implement alternative energy sources--the so-called technology options. I will just close by pointing out that as long as we ignore demographic and cultural issues, the growth in the first two factors will continue to offset all of the improvement we make in factors 3 and 4. And so until we can understand how to begin reducing the growth in the first two factors, climate change is a foregone conclusion.

[Dr. Meadows finished with a little clapping game to show that actions speak louder than words with respect to reducing population growth. He did not finish all of his slides--which is why I have omitted some.]

[Postscript by Gail. Dr. Meadows clearly sees capital somewhat differently than I have been looking at it. His model does not seem to incorporate debt. To me, it seems like debt allows resource developers effectively to obtain capital temporarily for nothing, by promising some of the future output of the positive feedback loop shown in Slide 15, including interest, back to lenders. When returns start slipping (because of the two forces Dr. Meadows mentions--higher resource extraction costs and higher costs of handling pollution sinks)--there is not enough money to pay back money lenders, and the system starts unraveling quickly, as we have recently been witnessing.

I think that inequity in the sharing of the outputs of the resource loop shown in Slide 15 is helping the system to continue to provide the level of capital investment that is now being provided. If the outputs were being shared equally, we would find that workers would be benefiting proportionately with bankers, and rich countries would be benefiting proportionately with poor countries. Our children would have an equal chance at getting high-paying jobs that we who are parents of young adults have had. This inequity in sharing seems to me to play a big part in what funds for re-investment remain.

The recent emphasis on renewables is in the direction of causing even higher capital needs. To the extent that this takes needed capital away from unglamorous parts of the system that are necessary for the system to survive, it could lead the system to fail earlier than it otherwise would.]

Monday, January 4, 2010

Euroopa koopereerub, et ehitada "taastuvenergia supergrid"

Ouna AntsRe: Alternatiivenergia kasutuselevõtust teenivad firmad04/01/10 21:55

Uue aasta alguse puhul ka üks särav visioon:
guardian.co.uk on Energy: Sun, wind and wave-powered: Europe unites to build renewable energy 'supergrid'

Idee on siis vana - ühendada väga erinevate Euroopa piirkondade erinevat liiki elektrijaamad omavahel kõrgepinge-alalisvoolu kaablitega. Nii kasutatakse vaheldumisi tuule-, päikese-, laine- ja hüdroenergiat. Piirkondade vahelised ühendused võimaldaks kasutada näiteks Norra hüdroelektrijaamade võrku kui hiiglaslikku looduslikku akut. Samas oleks võimalik kasutusele võtta ka võimsaid tuule- ja päikeseenergiaparke, mis omaette ei tuleks kõne alla.
Tundub, et Euroopa Liidu lubadus – aastaks 2020 pärineb 20% energiast taastuvatest energiaallikatest – ei ole üdini ebarealistlik.
Võrgu hind: € 30B (=£ 26.5bn).

Sunday, January 3, 2010