| tohlakas | Re: Kui palju inimtegevus kliimat mõjutab? | 15/12/09 00:56 |
|---|---|---|
| Mehed ja naised, vaatame tõele näkku - me kõik siin foorumis oleme hedonistid, kes oma mugavast pesas tarbivad meelelahutust, mida maailm meile pakub interneti, CNN-i ja igasuguste teiste infotainment kanalite kaudu. Kõik teevad näo, et nad hoolivad, tegelikult me tarbime omaks meelelahutuseks seda stuffi. Käime toredal rahvamatkal Kopenhaagenis näiteks, et näidata, kuidas me eriliselt hoolime jne... Loomulikult teeme me panuseid erinevatele võitluskukkedele, aga see on pigem puhas meelelahutus. Ütleks ausalt välja, et mind ei koti, kas ma pean säästupirne ostma või bensiini eest rohkem maksma. Oma tarbimisharjumusi ma nagunii ei muuda, sest mulle ei meeldi näiteks saasta süüa ja kehva jooke juua. Samuti ei meeldi mulle halva autoga sõita ning koleda naisega armatseda. Aga see selleks, ei maksa teha nägu, et see kõik meile koledalt korda läheks. Ma tean väga hästi, et biokütuste tootmine on kuritegelik nälgivate inimeste suhtes, aga ilmselt siis on vaja kliimaprobleemi nime all maailma rahvastikku vähendada, või mis iganes. Puhas darwinism. Ja kui ma näen, et CO2-ga kauplemine teeb mind rikkamaks, siis ilmselt ma panustan oma rahanatukest ka sellese sektorisse. http://www.lhv.ee/forums/index.cfm?id=196424&start=951#974 | ||
Monday, December 28, 2009
OzBot vahendab LHV foorumist

Maailmalõpuarengute proxy play
| suffiks | Re: Arco Vara (ARC1T) | 27/11/09 19:06 |
|---|---|---|
| Arco tulemustest lõik: 9 kuu seisuga pole täiendavalt diskonteeritud nõuet AS Ühendatud Kapitali vastu, mille bilansiline maksumus on hetkel 64,1 mln krooni (4,1 mln eurot). 20.11.2009 toimus Tallinna Arbitraažikohtu I istung, mille otsus tehakse osapooltele teatavaks eeldatavasti 21.12.2009. Ehk Tallinna Arbitraazhikohus teeb otsuse Arco suhtes täpselt 3 aastat enne maiade poolt ennustatud ja Roland Emmerichi poolt kinnitatud maailmalõppu. Coincidence? I think not. Edaspidi tuleb järelikult jälgida Arcoga toimuvat, kuna tegu on ilmselgelt maailmalõpuarengute proxy playga. | ||
Thursday, December 24, 2009
Copenhagen climate change conference 2009 Copenhagen climate conference How do I know China wrecked the Copenhagen deal? I
Copenhagen was a disaster. That much is agreed. But the truth about what actually happened is in danger of being lost amid the spin and inevitable mutual recriminations. The truth is this: China wrecked the talks, intentionally humiliated Barack Obama, and insisted on an awful "deal" so western leaders would walk away carrying the blame. How do I know this? Because I was in the room and saw it happen.
China's strategy was simple: block the open negotiations for two weeks, and then ensure that the closed-door deal made it look as if the west had failed the world's poor once again. And sure enough, the aid agencies, civil society movements and environmental groups all took the bait. The failure was "the inevitable result of rich countries refusing adequately and fairly to shoulder their overwhelming responsibility", said Christian Aid. "Rich countries have bullied developing nations," fumed Friends of the Earth International.
All very predictable, but the complete opposite of the truth. Even George Monbiot, writing in yesterday's Guardian, made the mistake of singly blaming Obama. But I saw Obama fighting desperately to salvage a deal, and the Chinese delegate saying "no", over and over again. Monbiot even approvingly quoted the Sudanese delegate Lumumba Di-Aping, who denounced the Copenhagen accord as "a suicide pact, an incineration pact, in order to maintain the economic dominance of a few countries".
Sudan behaves at the talks as a puppet of China; one of a number of countries that relieves the Chinese delegation of having to fight its battles in open sessions. It was a perfect stitch-up. China gutted the deal behind the scenes, and then left its proxies to savage it in public.
Here's what actually went on late last Friday night, as heads of state from two dozen countries met behind closed doors. Obama was at the table for several hours, sitting between Gordon Brown and the Ethiopian prime minister, Meles Zenawi. The Danish prime minister chaired, and on his right sat Ban Ki-moon, secretary-general of the UN. Probably only about 50 or 60 people, including the heads of state, were in the room. I was attached to one of the delegations, whose head of state was also present for most of the time.
What I saw was profoundly shocking. The Chinese premier, Wen Jinbao, did not deign to attend the meetings personally, instead sending a second-tier official in the country's foreign ministry to sit opposite Obama himself. The diplomatic snub was obvious and brutal, as was the practical implication: several times during the session, the world's most powerful heads of state were forced to wait around as the Chinese delegate went off to make telephone calls to his "superiors".
Shifting the blame
To those who would blame Obama and rich countries in general, know this: it was China's representative who insisted that industrialised country targets, previously agreed as an 80% cut by 2050, be taken out of the deal. "Why can't we even mention our own targets?" demanded a furious Angela Merkel. Australia's prime minister, Kevin Rudd, was annoyed enough to bang his microphone. Brazil's representative too pointed out the illogicality of China's position. Why should rich countries not announce even this unilateral cut? The Chinese delegate said no, and I watched, aghast, as Merkel threw up her hands in despair and conceded the point. Now we know why – because China bet, correctly, that Obama would get the blame for the Copenhagen accord's lack of ambition.
China, backed at times by India, then proceeded to take out all the numbers that mattered. A 2020 peaking year in global emissions, essential to restrain temperatures to 2C, was removed and replaced by woolly language suggesting that emissions should peak "as soon as possible". The long-term target, of global 50% cuts by 2050, was also excised. No one else, perhaps with the exceptions of India and Saudi Arabia, wanted this to happen. I am certain that had the Chinese not been in the room, we would have left Copenhagen with a deal that had environmentalists popping champagne corks popping in every corner of the world.
Strong position
So how did China manage to pull off this coup? First, it was in an extremely strong negotiating position. China didn't need a deal. As one developing country foreign minister said to me: "The Athenians had nothing to offer to the Spartans." On the other hand, western leaders in particular – but also presidents Lula of Brazil, Zuma of South Africa, Calderón of Mexico and many others – were desperate for a positive outcome. Obama needed a strong deal perhaps more than anyone. The US had confirmed the offer of $100bn to developing countries for adaptation, put serious cuts on the table for the first time (17% below 2005 levels by 2020), and was obviously prepared to up its offer.
Above all, Obama needed to be able to demonstrate to the Senate that he could deliver China in any global climate regulation framework, so conservative senators could not argue that US carbon cuts would further advantage Chinese industry. With midterm elections looming, Obama and his staff also knew that Copenhagen would be probably their only opportunity to go to climate change talks with a strong mandate. This further strengthened China's negotiating hand, as did the complete lack of civil society political pressure on either China or India. Campaign groups never blame developing countries for failure; this is an iron rule that is never broken. The Indians, in particular, have become past masters at co-opting the language of equity ("equal rights to the atmosphere") in the service of planetary suicide – and leftish campaigners and commentators are hoist with their own petard.
With the deal gutted, the heads of state session concluded with a final battle as the Chinese delegate insisted on removing the 1.5C target so beloved of the small island states and low-lying nations who have most to lose from rising seas. President Nasheed of the Maldives, supported by Brown, fought valiantly to save this crucial number. "How can you ask my country to go extinct?" demanded Nasheed. The Chinese delegate feigned great offence – and the number stayed, but surrounded by language which makes it all but meaningless. The deed was done.
China's game
All this raises the question: what is China's game? Why did China, in the words of a UK-based analyst who also spent hours in heads of state meetings, "not only reject targets for itself, but also refuse to allow any other country to take on binding targets?" The analyst, who has attended climate conferences for more than 15 years, concludes that China wants to weaken the climate regulation regime now "in order to avoid the risk that it might be called on to be more ambitious in a few years' time".
This does not mean China is not serious about global warming. It is strong in both the wind and solar industries. But China's growth, and growing global political and economic dominance, is based largely on cheap coal. China knows it is becoming an uncontested superpower; indeed its newfound muscular confidence was on striking display in Copenhagen. Its coal-based economy doubles every decade, and its power increases commensurately. Its leadership will not alter this magic formula unless they absolutely have to.
Copenhagen was much worse than just another bad deal, because it illustrated a profound shift in global geopolitics. This is fast becoming China's century, yet its leadership has displayed that multilateral environmental governance is not only not a priority, but is viewed as a hindrance to the new superpower's freedom of action. I left Copenhagen more despondent than I have felt in a long time. After all the hope and all the hype, the mobilisation of thousands, a wave of optimism crashed against the rock of global power politics, fell back, and drained away.
Wednesday, December 23, 2009

Tuesday, December 22, 2009

Monday, December 21, 2009
International Energy Agency
Wiki info
Allegations of Inflated Production Estimates
The IEA has been criticized for allegedly inflating estimates of global oil reserves. Proponents of the Peak Oil hypothesis in particular have charged that the agency's published estimates are unrealistic and, in fact, they often have been subsequently revised downward. In November 2009, an unnamed "senior official" stated that the IEA consistently over-estimated global oil supply in response to pressure from the United States government.
Key oil figures were distorted by US pressure, says whistleblowe - artikkel selle aasta novembris.
Sellele järgnes veel üks Guardian`i artikkel.
Siis Colin Campbelli kiri Guardian`i toimetajale.
Samas on ka IEA ise kriitiline, artikkel siin.
PO on täiesti lootusetu teema
PO on täiesti võimatu teema. Kõvasti hullem kui kliima. Kui kliima puhul oli võimalik minu arust mingi kindel alus leida siis nafta on nõnda armas teatud grupile, et tõde varjatakse väga kiivalt.
Siin klipis on mõned tuntumad ja tegijmad post-peak-oil teadlased.
Siin klipis on mõned tuntumad ja tegijmad post-peak-oil teadlased.
Friday, December 18, 2009
Iran Forces Occupy Iraqi Oil Well, Border Guard Says
Dec. 18 (Bloomberg) -- Iranian forces yesterday entered Iraqi territory at dawn and occupied well number 4 in the East Maysan oil field, Border Guard General Zafer Nazmi said.
The Iranian forces positioned tanks around the well, which is in the al-Fakah region, 450 kilometers (280 miles) south of Baghdad. The two neighbors have disputed the border of southeast Iraq for decades.
“They positioned tanks around it and dug trenches,” General Nazmi said by phone from Basra. “They are still there, they raised the flag.”
East Maysan in southern Iraq is an old oil field that is no longer in production, according to Nazmi. Iraq is the third largest oil producer in the Middle East after Saudi Arabia and Iran.
Energy analysts and traders were surprised at the news, which comes days before Iran and Iraq meet fellow members of the Organization of Petroleum Exporting Countries at a Dec. 22 meeting in Luanda, Angola.
Crude oil for January delivery rose as much as $2.04, or 2.8 percent, to $74.69 a barrel on the New York Mercantile Exchange. It traded at $74.58 a barrel at 2:19 p.m. London time.
Iran and Iraq waged an eight-year war that ended in 1988, with much of the fighting along the border between southern Iraq and Iran. Iraq has this year signed contracts with several foreign companies to develop its oil fields to revive production.
OPEC Meeting
“From a geopolitical perspective it is a surprising development in terms of timing, considering the upcoming OPEC meeting,” said Harry Tchilinguirian, senior oil analyst with BNP Paribas SA in London.
“If verified, the incursion only goes to highlight the still very uncertain conditions on the ground in Iraq that have been impeding the recovery of the country’s oil sector,” Tchilinguirian said.
Iraq’s National Security Council will hold a meeting to discuss the situation, state-run television al-Iraqiya said. Iraq’s al-Hurra television station also reported that Iranian forces crossed the border into Iraq, citing the U.S. army saying the incident was not violent.
Baghdad-based government spokesman Ali al-Dabbagh didn’t immediately respond to e-mails and mobile telephone calls seeking comment. Calls to Iran’s presidential office, Foreign Ministry and Ministry of Defense were not answered. Friday is the weekend in Iran. A spokesman for the Iranian embassy in London declined to comment.
Hiina rendib Kasahstanilt miljon hektarit maad põllumajanduseks
http://www.arileht.ee/artikkel/485075
Usutavasti polegi Hiina peamine probleem selles, et poleks põllumaad, mida harida, vaid pigem saastatus ning vähene keskkonnasäästlikkus. Ebaefektiivsed maaharimismoodused arvatavasti pealekauba. Aga kui raha ning võimalust on, siis paistab, et "fresh start" meeldib neile rohkem kui oma olukorra parandamine.
Usutavasti polegi Hiina peamine probleem selles, et poleks põllumaad, mida harida, vaid pigem saastatus ning vähene keskkonnasäästlikkus. Ebaefektiivsed maaharimismoodused arvatavasti pealekauba. Aga kui raha ning võimalust on, siis paistab, et "fresh start" meeldib neile rohkem kui oma olukorra parandamine.
Colin Campbell comments recent article in the Guardian
Colin Campbell, founder of ASPO, has written a comment to the recent article about the IEA whistleblower from the newspaper the Guardian. Dr Campbells comments are available from below:
Hea lühike artikkel - peak oil teemal
Hea lühike artikkel - peak oil teemal
Thursday, December 17, 2009
Kaks numbrit, üks tõde
Panin vasakusse nurka kaks indikaatorit: nafta hind ja CO2 tase.
Selle arvamuse* järgi peab nafta hind olema odavam kui 147 dollarit barrelli kohta, et ei pidurduks uue tehnoloogia areng. Täna nafta 71,30.
CO2 peab aga jääma alla 450ppm. Täna CO2 sisaldus atmosfääris 385,99 ppm.
Let the rat race begin!
*seda arvamust tuleb täpsustada
Selle arvamuse* järgi peab nafta hind olema odavam kui 147 dollarit barrelli kohta, et ei pidurduks uue tehnoloogia areng. Täna nafta 71,30.
CO2 peab aga jääma alla 450ppm. Täna CO2 sisaldus atmosfääris 385,99 ppm.
Let the rat race begin!
*seda arvamust tuleb täpsustada
The Magic Price Incentive Band
SIIT
The Magic Price Incentive Band
In my public talks, I often hear people say that my predictions for the future are wrong because when the price of oil goes up we will move to something else. The high price will provide a greater incentive to move to alternatives. That's true — but it's not the whole story. The price of oil must meet all of these conditions:
- it must be high enough to encourage the move to alternatives
- it must be sustained, that is, not volatile, and
- it must not get too high.
If the price is too low, obviously there isn't much incentive to move to an alternative except for those who understand the damage our use of oil is causing or who understand it's not going to be abundant much longer.
If there is too much price volatility, people will be unsure it is wise to spend money on alternatives. They keep the equipment they have and wait for more certainty. That's why SUV sales have gone back up now that gas is (temporarily) lower.
If the price goes too high too quickly, like it did in 2008, economic damage occurs. Businesses shrink, lay off people and struggle to survive. Now they don't have the money to purchase the equipment that would get them off of oil. In many cases they aren't in business at all any more.
The price must stay within the Magic Price Incentive Band:

We don't know what the Magic Price Incentive Band for getting off oil is. But we're pretty sure $147 per barrel is way too high.
A sustained price of $50 for a few years, then $60 for a few more, etc. would probably have been enough of a market signal for people to clamor for alternatives like electric vehicles.
Although sustained, stable prices are required, the market place cannot guarantee that — and there was no will by the population to pay more for gasoline. Legislation to increase the price of gas often would never even get to a vote. (In some areas, we humans are just lousy at preparing for the future.)
Recessions Follow Oil Price Increases
A recession has followed every significant oil price increase. (Consider my blog entry Estimating the Economic Impacts of Peak Oil.)
Although our current economic malaise is blamed on the credit crisis, people forget what happened to the price of oil.
In 2008 the average price of oil was $99 per barrel (per the Energy Information Administration). The year before it was $72 per barrel.
| Year | Oil Price (WTI) | Total Spent on Oil |
| 2007 | $72 | $2.160 trillion |
| 2008 | $99 | $2.970 trillion |
In just one year, that price difference sucked an additional $810 billion from the world economy.
The same level of increase happened from 2006 to 2007. Simply put, we were going to have a global recession even if the credit crisis hadn't occurred. See the paper by Hamilton "Causes and Consequences of the Oil Shock of 2007-8" for more detail (http://tr.im/jHan).
By the way, did you notice that the price increase is roughly the same as the current stimulus package? Do you think any future stimulus package will have any effect when oil goes back up in price?
High Oil Prices Undermine the Move to Alternatives
We can see this mechanism most easily with the auto industry. Annual car sales went from a high of 16 million in 2007 to just over half that now, 8.8 million, on an annualized basis (April 2009) and the fleet turnover rate went from 15 years to 27 years. At this turnover rate, every vehicle in every showroom could be electric right now and we still wouldn't get them out into the populace in time. As it is, there isn't even a production quantity electric vehicle available for purchase as I write this (the Tesla Roadster doesn't count).
When you consider that long-haul trucking, mining operations and construction machinery all use oil, too, you can start to see why we started too late.

The End of the Car Age
In other words, the recent high price of oil has destroyed much of the capacity for us to move off of oil. When you pull together these items:
- the date of peak oil (most likely 2008 since so many oil projects are being canceled)
- the still-increasing fleet turnover rate
- a collapsing economy
you can see why Kunstler (and now me too) tell people that most Americans have bought their last car. I don't mean their last "gasoline powered" car, I mean any car.
Unfortunately, the same mechanism is playing out in the renewable energy sector. Investment is down by almost half.
Enlightened government could have put a floor under oil prices for the previous three decades, thus moving us completely off oil while we had the economy to do it. Now it's too late.
Period of Receding Horizons
We have entered the Period of Receding Horizons. This is when our goal of moving off fossil fuels is getting further away every moment instead of closer. Our economy has actually lost the capacity to move off of fossil fuel without massive contraction first to a fraction of its former size. This will not be a pleasant contraction at all. The millions of people now being laid off will never find jobs at the same wage again. You could call it the Death Spiral and the name, I think, is apt.
Alternatives to the Car
As we get poorer (which is happening very quickly), we are going to become a nation of bicycle and scooter riders. There are several good electric scooters and electric motorcycles on the market, which are the products to buy if you want to avoid lining up for your gas ration.
Of course, a few of us will be driving electric cars by 2012 and by all means buy one if you can get your hands on one. However, there won't be more than a few hundred thousand highway-capable electric cars on the road before we are too poor to buy them. If we're really lucky then it might be a few million.
But a whole electric fleet? Never going to happen. We are entering Energy Descent largely with the fleet we have.
Estimating the Economic Impacts of Peak Oil
Võetud siit
March 7, 2008
How fast does the economy decline as oil production declines? In his latest report, drawing on various sources, Robert Hirsch reasons that the correlation is 1:1. A 2.5% annual decline rate will shrink the global economy by 25% in 10 years. Other reports substantiate that ratio.
Introduction
I've been doing research to bracket the economic effects of a power down/energy descent scenario and these papers give me what I'm looking for. In all cases, see the papers for the complete discussion but I've summarized what I'm interested in below. I recommend reading all four reports but in a pinch you could skip the Sill and Ayres ones.
Hirsch
Hirsch uses at 1:1 correspondence between oil decline and GDP decline by using Deutsche Bank's high number (2.5) and the ratios of the impact to the GDP to oil decline from the oil shocks of the 70's on the low end (0.7 and 0.6). He reasons that unity (i.e. a 1 to 1 correlation) is the correct order of magnitude to use in estimates. He also discusses various shortage scenarios and projected peak and plateau fall-off dates.
Ayres and Warr
They demonstrate what classical economics fails to do because it does not include an energy input. Classical economics addresses capital, labor and resource inputs but does not have a factor for energy. Ayers and Warr calculate a perfectly intuitive 0.7 for elasticity of demand (see Figure 10) using curve fitting when they introduce energy converted to useful work, and the correlation is excellent. This is in line with Hirsch's ratios. Apparently there has been no significant push back from economists even though their paper essentially jettisons the prevailing economic theory. (It appears that people knew the current theory was broken it just took a while to figure out how to fix it.)
Sill
Sill surveys previous oil shocks and comes up with a loss to the GDP of up to 1.4% over four quarters given a 10% price increase or a 10% production shortfall. Note that this is quite a bit different than the Ayers and Warr number but shocks are transient events, not sustained declines. Therefore in my thinking I treat Sill's numbers as applicable only during very sudden oil contraction.
Rubin
There are three major points from his January 08 report. First, many major oil megaprojects are delayed, which means oil will not be entering the market as quickly as the oil megaprojects database first indicated (http://en.wikipedia.org/wiki/Oil_megaprojects). In fact, I've been watching the 2008 projection and it has been slowly but steadily moving down as projects get delayed (retrieved March 6, 2008). 2008: 6842 2009: 7089 2010: 3785 2011: 4258 2012: 5124 2013: 282 2014: 430 2015: 592 Incidentally, the value for 2013 -- well within our average horizon of six years -- still has not moved appreciably up. Second, Rubin uses an annual global decline rate from existing fields of almost 4 mb/d. Third, the smaller amount of new production that will be entering the market will mostly be used domestically by the oil producing countries. Given all the above, see Table 1 on page 4 for the new production projected to be available to OECD countries. Not much. The projected result? $150/barrel in 08 but we aren't going to fall off the plateau just yet.
Conclusions
The literature points to an economic impact in the order of magnitude of unity. The good news is that it isn't a 10 to 1 ratio. The bad news is that it is clear that beyond the first year where some efficiency and voluntary curtailment might buffer the situation, our GDP will decline at approximately the rate oil declines. In reality, easy initial efficiency measures and curtailment will already have occurred due to the high prices leading up to the decline i.e. they are occurring now. See Rubin's report for more on that. Thus I think it would be unwise to expect any future buffer from efficiency or voluntary curtailment like how California managed to shave 11% off its electricity use voluntarily during the blackouts. In other words, I'm confident in the math to publicly say that a 1% decline in oil consumption will equal approximately a 1% decline in GDP once we fall off the oil production plateau we're on. Naturally this will not continue to zero and I do not have any research yet that can give us a feel of how long that relationship will hold (until we reach 25% from peak? 50% from peak?). My operating assumption is that the relationship will hold long enough to cause a major economic discontinuity. With the annual oil decline rate expected to range between 2% and 5% (see Hirsch, 2008) and the Oakland Peak Oil report using 2.6%, we will have a massive unemployment and homelessness problem on our hands. It also seems reasonable to expect that a great deal of wealth will be destroyed during the decline, as is happening now in the current credit crunch but on a larger scale.
- Mitigation of Maximum World Oil Production:Shortage Scenarios, Hirsch, 2008
- Delays Will Tighten Global Oil Markets (PDF), CIBC World Markets, Rubin, 2008
- The Macroeconomics of Oil Shocks (PDF), Philadelphia Fed, Sill, 2007
- Accounting For Growth: The Role Of Physical Work (PDF), INSEAD, Ayres and Warr, 2004
Cinoomi Jõuluõnnitlused: Randroidi Tipp ehk R-Peak
 Randroidi Tipp ehk R-Peak
Aeg: 17. detsember 2009, kella 1400-1530 vahel
Koht: Restoran Ribe, Vene tn 7, Tallinn, Estonia
Millega saavutati tipp: foie gras ehk hane maks
ARMASTAMA OMA TIPPU, SEE ON ERILINE, SEE EI TULE ENAM KUNAGI TAGASI. RANDROID ja TEMA FOIE GRAS
videot vaadates asenda sõna OIL sõnaga HANE MAKS
*pühendusega Cinoomilt kooskõlastatud Randroidiga
Peak Oil Primer
SIIT VÕETUD
1. Peak oil primer
What is peak oil?
Peak oil is the simplest label for the problem of energy resource depletion, or more specifically, the peak in global oil production. Oil is a finite, non-renewable resource, one that has powered phenomenal economic and population growth over the last century and a half. The rate of oil 'production', meaning extraction and refining (currently about 84 million barrels/day), has grown almost every year of the last century. Once we have used up about half of the original reserves, oil production becomes ever more likely stop growing and begin a terminal decline, hence 'peak'. The peak in oil production does not signify 'running out of oil', but it does mean the end of cheap oil, as we switch from a buyers' to a sellers' market. For economies leveraged on ever increasing quantities of cheap oil, the consequences may be dire. Without significant successful cultural reform, severe economic and social consequences seem inevitable.
Why does oil peak? Why doesn't it suddenly run out?
Oil companies have, naturally enough, extracted the easier-to-reach, cheap oil first. The oil pumped first was on land, near the surface, under pressure, light and 'sweet' (meaning low sulfur content) and therefore easy to refine. The remaining oil is more likely to be off-shore, far from markets, in smaller fields and of lesser quality. It therefore takes ever more money and energy to extract, refine and transport. Under these conditions, the rate of production inevitably drops. Furthermore, all oil fields eventually reach a point where they become economically, and energetically, no longer viable. If it takes the energy of a barrel of oil to extract a barrel of oil, then further extraction is pointless, no matter what the price of oil.
M. King Hubbert – the first to predict an oil peak
 |
| The Hubbert Curve is used to predict the rate of production from an oil producing region containing many individual wells. Source: aspoitalia.net |
In the 1950s the well known U.S. geologist M. King Hubbert was working for Shell Oil. He noted that oil discoveries graphed over time tended to follow a bell shape curve. He supposed that the rate of oil production would follow a similar curve, now known as the Hubbert Curve (see figure). In 1956 Hubbert predicted that production from the US lower 48 states would peak between 1965 and 1970. Despite efforts from his employer to pressure him into not making his projections public, the notoriously stubborn Hubbert did so anyway. In any case, most people inside and outside the industry quickly dismissed the predictions. As it happens, the US lower 48 oil production did peak in 1970/1. In that year, by definition, US oil producers had never produced as much oil, and Hubbert's predictions were a fading memory. The peak was only acknowledged with the benefit of several years of hindsight.
No oil producing region fits the bell shaped curve exactly because production is dependent on various geological, economic and political factors, but the Hubbert Curve remains a powerful predictive tool.
In retrospect, the U.S. oil peak might be seen as the most significant geopolitical event of the mid to late 20th Century, creating the conditions for the energy crises of the 1970s, leading to far greater U.S. strategic emphasis on controlling foreign sources of oil, and spelling the beginning of the end of the status of the U.S. as the world's major creditor nation. The U.S. of course, was able to import oil from elsewhere. Mounting debt has allowed life to continue in the U.S. with only minimal interruption so far. When global oil production peaks, the implications will be felt far more widely, and with much more force.
What does peak oil mean for our societies?
Our industrial societies and our financial systems were built on the assumption of continual growth – growth based on ever more readily available cheap fossil fuels. Oil in particular is the most convenient and multi-purposed of these fossil fuels. Oil currently accounts for about 43% of the world's total fuel consumption [PDF], and 95% of global energy used for transportation [PDF]. Oil and gas are feedstocks for plastics, paints, pharmaceuticals, fertilizers, electronic components, tyres and much more. Oil is so important that the peak will have vast implications across the realms of war and geopolitics, medicine, culture, transport and trade, economic stability and food production. Significantly, for every one joule of food consumed in the United States, around 10 joules of fossil fuel energy have been used to produce it.
The 'Hirsch Report'
A U.S. Dept. of Energy commissioned study “Peaking of World Oil Production: Impacts, Mitigation and Risk Management” [PDF] was released in early 2005. Prepared by Science Applications International Corporation (SAIC), it is known commonly as the Hirsch Report after its primary author Robert L. Hirsch. For many months the report, although available on the website of a Californian High School, remained unacknowledged by the DOE. The executive summary of the report warns that:
as peaking is approached, liquid fuel prices and price volatility will increase dramatically, and, without timely mitigation, the economic, social, and political costs will be unprecedented. Viable mitigation options exist on both the supply and demand sides, but to have substantial impact, they must be initiated more than a decade in advance of peaking. [Emphasis added.]
A later paper by Hirsch recommends the world urgently begin spending $1 trillion per year in crash programs for at least a decade, preferably two, before peaking. Obviously, nothing like the kind of efforts envisaged have yet begun. Hirsch was not asked to speculate on on when the peak was likely to occur.
So when will oil peak globally?
Later in life M. King Hubbert predicted a global oil peak between 1995 and 2000. He may have been close to the mark, except that the oil shocks of the 1970s slowed the growth of our use of oil.
As represented in the following figure, global oil discovery peaked in the late 1960s. Since the mid-1980s, oil companies have been finding less oil than we have been consuming.

Of the 65 largest oil producing countries in the world, up to 54 have passed their peak of production and are now in decline, including the USA in 1970, Indonesia in 1997, Australia in 2000, the UK in 1999, Norway in 2001, and Mexico in 2004. Hubbert's methods, as well as other methodologies, have been used to make various projections about the global oil peak, with results ranging from 'already peaked', to the very optimistic 2035. Many of the official sources of data used to model oil peak such as OPEC figures, oil company reports, and the USGS discovery projections, upon which the international energy agencies base their own reports, can be shown to be frighteningly unreliable. Several notable scientists have attempted independent studies, most famously, Colin Campbell with the Association for the Study of Peak Oil and Gas (ASPO).

Already peaked? ASPO's latest model suggests that regular conventional oil reached an all time peak in 2005. If heavy oil, deep-water, polar and natural gas liquids are considered (the 'all-liquids' category), the model suggests that this peak too is behind us, in 2008. Combined oil and gas is expected to have peaked globally simultaneously in 2008.
Other notable researchers such as Princeton University Professor Emeritus Kenneth Deffeyes, senior advisor to the Iranian National Oil Company A. M. Samsam Bakhtiari, UK Petroleum Review editor Chris Skrebowski, energy banker and former advisor to US President G.W. Bush Matthew Simmons and the researchers at The Oil Drum, have all projected similar peaks within the 2005-2011 range using much varied methodology. A 2007 survey suggests that their perspective has become the consensus among informed observers and industry insiders [PDF].
Other sources supporting the view that global crude oil has already peaked globally include a study by the German Government sponsored Energy Watch Group, oil billionaire T. Boone Pickens, and the former head of exploration and production at Saudi Aramco, Sadad al-Huseini, and the Wikipedia hosted Oil Megaprojects database. As of April 2009, the peak of all-liquids production was July 2008.
Decline rates
Whether or not we've passed the peak, a more significant question may be: What will be the future rate of decline of oil production? Some form of co-ordinated adaptation might be possible if the annual drop in available oil was no more severe than 1-2% a year. Whereas 10% or more would soon implode the global economy. Most models project decline rates of 2-4%.
Exports
Nations dependent on imports are likely to find that their access to oil will fall at a far sharper rate than the global decline rate. During shortages, higher oil prices stimulate the economy of exporting nations which increases their internal consumption. Combined with a national peak in oil production, exports from any particular nation can drop to zero disturbingly quickly.
Natural gas peak
The effects of natural gas peak are relatively localized. This is due to the enormous economic and energetic expense of liquefying and transporting natural gas as a compressed liquid. Both European and North American natural gas production have likely already peaked, so these regions are facing the extra severity of a dual energy crisis.
Financial collapse and oil peak
After several years of rapid growth, the global crude price began falling in lockstep with financial markets in 2008, a fact which may have both contributed to – and masked – a concurrent global oil production peak. The oil industry has been running on a treadmill since 2005 with production staying essentially flat. Capital for oil infrastructure investments, which might have seen new production continue to offset declines for a few more years yet, has withered.
Conversely, the financial collapse itself was triggered in part by the approach of peak oil: higher commuting costs due to soaring oil prices set off the 'exurb' house price collapse in the US and put stress on mortgage repayments, leading to the subsequent collapse of the mortgage backed securities bubble and further financial unraveling. But this was merely a trigger event. In the long run, peak oil poses far more fundamental challenges to our dominant economic systems which are predicated on perpetual growth.
But it's just oil and gas – there are other fossil fuels, other energy sources, right?
To evaluate other energy sources it helps to understand the concepts of Net Energy, or the Energy Returned On Energy Invested ratio (EROEI). One of the reasons our economies have grown so abundant so quickly over the last few generations is precisely because oil has had an unprecedentedly high EROEI ratio. In the early days of oil, for every barrel of oil used for exploration and drilling, up to 100 barrels of oil were found. More recently, as oil recovery becomes more difficult, the ratio has become significantly lower. Certain alternative energy 'sources' may actually have EROEI ratios of less than one, such as many methods of industrially producing biodiesel and ethanol, or extracting oil from shale. That is, when all factors are considered, you probably need to invest more energy into the process than you get back.
Hydrogen, touted by many as a seamless solution, is actually an energy carrier, but not an energy source. Hydrogen must be produced using an energy source such as natural gas or nuclear power. Because of energy losses in transformation, the hydrogen will always contain less energy than was invested in it.
Some alternatives such as wind and hydro-power may have much better EROEI, however their potential expansion may be limited by various physical factors. Even in combination it may not be possible to gather from renewable sources of energy anything like the rate and quality of energy that industrial society is accustomed to. Peak oil author Richard Heinberg uses the metaphor that whereas fossil fuels are akin to a massive inheritance, one spent rather drunkenly, renewables are much more like a hard won energy wage.
For certain tasks, such as air travel, no other energy source can readily be substituted for oil. As noted by the Hirsch reports, alternative energy infrastructures require long periods of investment, on the scale of decades, to be widely implemented. We may be already leaving the period of cheap energy before we have begun seriously embarking on this task.
It's worth noting briefly that any EROEI study is complex and different methods of accounting can come up with vastly different results, so any net energy study might be viewed with some suspicion. We may not know with total certainty the usefulness of any renewable energy technologies until the hidden fossil fuel energy subsidies are finally removed.
2. Further information
Peak oil and climate change: If peak oil merely threatens industrial civilisation, climate change promises to destabilize the planetary biosphere. The two issues are integrally related, and solutions to peak oil can also address climate change. Consider how we might bridge peak oil and climate change activism. David Holmgren has begun integrating peak oil and climate change into a global scenario planning framework.
Peak coal: Recent studies suggest that we may reach 'peak coal' much sooner than previously thought. Chris Vernon rounds up five recent reports to that effect over at The Oil Drum: Europe.
Peak everything: Peak Everything is the name of a book by peak oil author Richard Heinberg. Globally we have already passed peaks or are soon to be facing them in copper, phosphorous, fish catches, grain production, per capita fresh water and uranium to name but a few. This is no coincidence, we have been consuming the world's resources at an unprecedented rate. The human population, which has risen in lockstep with fossil fuel production, will likely peak more or less in sync with these fuels.
Oil and food production: Essays The Oil We Eat by Richard Manning, and Eating Fossil Fuels by Dale Allen Pfeiffer both look at modern agricultures' dependence on fossil fuels. Both are highly recommended.
Audio and video:
Global Public Media – essential interviews on peak oil and environmental issues (Now integrated into Energy Bulletin.)
Peak Oil? – a 44 minute TV special from Four Corners (Australia), viewable online (July 2006)
The End of Suburbia and A Crude Awakening – two excellent peak oil documentaries purchasable on DVD.
Research and reference articles:
ASPO – original research from The Association for the Study of Peak Oil & Gas
ASPO Ireland – the Irish branch of ASPO through which Colin Campbell now publishes the ASPO monthly newsletter (Note: In April 2009 Colin published his 100th and final newsletter, his task of bringing the concept of peak oil into public light achieved.)
ASPO-USA publishes about 3 good articles every week (many of which are republished here)
The Oil Depletion Analysis Centre (ODAC) in the UK has a good website that is frequently updated
The Oil Drum – the breaking edge of community peak oil research
DieOff.com – an alarming but scholarly archive of research. The original peak oil website.
News and commentary:
The Oil Drum the daily Drum Beat is a collation of news stories
Peak Energy Australian Big Gav's aggregation and commentary on energy related news
Gristmill – environmental news and articles, with an increasing emphasis on energy, sustainability and climate
Resource Insights – Kurt Cobb publishes intelligent peak oil informed commentary on a broad range of issues.
Casaubon's Book – several essays and how-to articles a week from author, mother and farmer Sharon Astyk
James Kunstler's blog – peak oil commentary with a special focus on cultural decline. See both www.kunstler.com and jameshowardkunstler.typepad.com
Crisis Energética – peak oil news in Spanish
Mailing lists:
RunningOnEmpty3 – a group for peak oil beginners
EnergyResources – the original peak oil focused email list
RunningOnEmpty2 – a more solutions, self-sufficiency focused list
groups.yahoo.com/group/EnergyRoundTable – a group emphasizing discussion and politics
There are numerous local mailing lists too, many on yahoo can be found at this link:
groups.yahoo.com/search?query=peak%20oil&ss=1
More links, including books to read: An excellent list of links is maintained here:
www.dynamiclist.com/?worldview/peakoil
3. What can be done?
Many people are working on preparations for peak oil at various different levels, but there is probably no cluster of solutions which do not involve some major changes in lifestyles, especially for the global affluent. Peak oil presents the potential for quite catastrophic upheavals, but ultimately also some more hopeful possibilities: a chance to address many underlying societal problems, and the opportunity return to simpler, healthier and more community oriented lifestyles.
The Community Solution to Peak Oil. Many excellent resources are available through the website of this Ohio based organization "dedicated to the development, growth and enhancement of small local communities... that are sustainable, diverse and culturally sophisticated." The Community Solution have hosted several recent grassroots peak oil conferences, and have developed an important film, The Power of Community: How Cuba Survived Peak Oil, documenting how this country has relatively successfully adapted to a political oil peak after the collapse of the Soviet Union.
www.communitysolution.org
Permaculture: Permaculture is a 'design science' which can allow us to live in relative abundance with minimal resource use. Permaculture principles and practice can be applied to functionally redesigning social systems, built environments, ecological and agricultural practices the post-peak era. David Holmgren's 2001 book, Permaculture: Principles and Pathways Beyond Sustainability, deals explicitly with the global oil peak and proposes permaculture as the best set of strategies for dealing with what he terms 'energy descent'.
www.permacultureactivist.net
www.permacultureinternational.org
www.holmgren.com.au
Transition Towns: Several communities around the world have begun their own preparations for peak oil, and are documenting the process. The Kinsale Energy Descent Action Plan out of rural Ireland is the world's first local action plan for peak oil, dealing with broad issues relating to peak, including health, education, tourism and youth issues. The plan and its initiator Rob Hopkins have inspired the Transition Towns movement of peak oil preparing towns, focused in Europe. In the US, local organizers within the town of Willits, Califonia have begun work on the Willits Economic LocaLization Project (WELL). Many other communities around the world are embarking along similar paths.
www.transitionculture.org - Rob Hopkins' blog
www.transitiontowns.org
www.willitseconomiclocalization.org
Oil Awareness Meet Ups is a grass roots awareness raising network helping people meet up and discuss peak oil. Join or start a meet-up in your neighborhood.
oilawareness.meetup.com
Local Currencies and Steady State Economics:
Local Currencies: Richard Douthwaite, a 'recovering economist', has proposed a number of alternative monetary systems to deal with energy decline and the associated monetary crises which might arise post-peak. Local currencies like LETS are in operation around the planet already (although LETS itself may be somewhat problematic). Experiment now with local currencies to help survive economic crises.
The Foundation for the Economics of Sustainability (FEASTA) has some of Richard Douthwaite's publications available for free online, including entire books as well as masses of other excellent research and articles by other writers, relating not just to economics and local currencies, but to various aspects of sustainability.
See also: www.communitycurrency.org/resources.html
Intentional Communities: Intentional Community (IC) is an inclusive term for ecovillages, cohousing, residential land trusts, communes, student co-ops, urban housing cooperatives and other related projects and dreams... ICs represent one of the sanest ways of dealing with energy peak.
www.ic.org
gen.ecovillage.org
www.cohousing.org
The Oil Depletion Protocol: is a global framework for distributing the world's remaining oil reserves more equitably than free market forces would allow, to avoid resource wars, profiteering and economic collapse. Help promote it:
How to avoid oil wars, terrorism, and economic collapse by Richard Heinberg
Oil Depletion Protocol website
Tradable Energy Quotas (TEQs) are a system for rationing fuel which includes everyone – individuals, industry and the Government – and which enables users to sell any rations they do not use.
www.teqs.net
Lobbying: Lobby governments to spend now on renewable energy and improving agricultural practices. Many facts are summarized in the following 'convince sheet' by Bruce Thomson: greatchange.org/ov-thomson,convince_sheet.html
The Energy Problem and the Interplay Between Basic and Applied Research
Alustasin eile Steven Chu ettekande kuulamist, jõudsin poole peale. Sõnumiks on "tehnoloogia". Sellesse peame uskuma, kuid seda on nii kerge post-peak-oil staadiumis ümber lükata.
The situation facing our planet could hardly be more dire: There’s increasingly dangerous competition among nations for ever scarce energy resources, and climate change is racing ahead of predictions. Although Steven Chu believes “We are getting close to where it’s very nervous time,” he also sees “reason for hope.”
The situation facing our planet could hardly be more dire: There’s increasingly dangerous competition among nations for ever scarce energy resources, and climate change is racing ahead of predictions. Although Steven Chu believes “We are getting close to where it’s very nervous time,” he also sees “reason for hope.”
Energy Future: A Significant Period of Discomfort
Hetkel tutvun Robert Hirsch`ga - energy advisor and author of U.S. study on peak oil
publishing date: June 20, 2008
Energy expert Robert Hirsch says the world would need 20 years to prepare for peak oil. But declining global oil production could just be a few years away. Read how we can prepare and ultimately “beat” this problem.
You were the lead author of a groundbreaking 2005 study on future oil production and declining reserves. How is the situation three years later?
Today, the situation is worse, and the reason for this is that it is now obvious that world oil production is already on a plateau. It has reached a high level, and has leveled off. The point at which oil production will decline is probably not far away.
If the world started (to implement solutions) 20 years before the peak oil problem, we would have stood a very good chance of beating the problem and could have avoided significant negative consequences for our economy. As it turns out, we now don’t have 20 years; we don’t even have 10. It wouldn’t surprise me at all if oil production begins to decline within the next few years.
What happens when we reach a peak in oil production?
Anybody can see how important oil is in our everyday lives. Oil is basically the lifeblood of all modern economies. When world oil production goes into decline, the decline rate will be three to five percent, maybe more if there is withholding from oil producers. Those numbers don’t sound very big, but when it comes to conserving or replacing that missing fuel, they are huge.
Oil prices are going to escalate dramatically. They were about 130 dollars this morning. That’s going to be a low price compared to what they are likely to escalate to. There will have to be rationing, and there will be huge problems as different countries try to get the oil they need to sustain some kind of economic well-being. We are racing towards a future that will be very difficult, and we have to do what is necessary to not economically kill ourselves.
What about new oil discoveries, like the recent ones in Brazil? Can they turn the tide?
They definitely cannot. To bring those new oil fields into production will require something like five to ten years. The infrastructure needed to drill and produce that oil is very significant. Contributions like Brazil will be of value, but there is no conceivable discovery or discoveries that can possibly turn the tide.
What about the people that say, once the oil price is high enough, new and unconventional sources like tar sands in Canada can be used to produce oil?
The point is directionally correct. The problem is that it takes a very long time to build the machinery that is necessary to exploit oil shale, oil sands, coal-to-liquids or heavy oil. In our 2005 analysis we looked at a worldwide crash program to bring these things into being as fast as possible. We made a number of aggressive assumptions, because a crash program is different from business as usual.
But the problem is that the magnitude of oil production loss each year will be so large and the time required to implement these alternatives is so long that the problem runs away from you if we wait too long. And we have waited too long to seriously start. Eventually, these otions and energy efficiency will catch up. It is not as if the world is going to die. But right now, we are looking at a global recession that deepens each year for more than a decade because we are not prepared.
How is the situation outside the United States?
No one has really started to work on the problem anywhere in the world, except maybe in China, where they calculated a few years ago that oil decline might occur around 2012. China has begun with coal liquefaction and other technologies. In addition, they have gone abroad and bought into oilfields around the world. They have probably done more than anyone else to prepare. In most places, the problem is still unthinkable and not politically correct. Most of the rest of the world is not in very good shape to deal with the problem.
Why do you think peak oil is such a taboo?
The thing that is foremost in people’s mind when it comes to energy is climate change. People have pushed hard and governments have taken actions to cut down on the emissions of CO2. But in many cases, decisions are opposite to what we need to mitigate the problem of declining world oil supplies.
For example, coal liquefaction will make very good sense in many areas of the world. Using and liquefying coal is an available technology, but under current conditions, there would be a great deal of CO2 released from making liquids out of coal. So people say, “no, we are not going do these things because of CO2.” They do not recognize that if we don’t take action on the impending oil decline, populations are going to suffer beyond what most can imagine.
Many Americans dream of energy independence. Is it still possible?
Energy independence in the next three or four decades is impossible for most countries outside of OPEC. The reason is that the magnitude of the problem is enormous. There are a few countries that could conceive of energy independence, the United States being one. But we really haven’t started, and we can’t even agree on what we really want and what’s important. Sadly, that is one of the reasons why it is going to take a deepening recession and a great deal of personal hurt to get people to rethink their values and get motivated to do what’s needed to pull us out of the problem.
The International Energy Agency says we do not have a problem with resources, we have a problem with investments. So the situation is not that bad?
Yes, there is an investment problem, but what is hard to understand for many economists and most people is that there is a conventional oil resource limitation, and that oil is what provides more than 90 percent of the liquid fuels we are using today. We are reaching the maximum in production. It will tail off over time, but at a rate that will be extremely difficult for us to catch up to.
Will producing countries profit heavily from such a situation?
The folks that have the resources will make much more money once prices escalate. They will be in a very strong financial position.
Most people don’t recognize that those countries don’t have an obligation to produce their oil for us. We might think that those people are financially motivated, but OPEC countries now are swimming in money. They are having trouble finding places to use their money.
So when the peak oil scenario hits, a number of oil exporting countries are likely to cut back on oil production. It makes sense for them to conserve their resources for future generations. So the situation will be worse than it might be from a purely geological or investment standpoint. The King of Saudi Arabia recently said that any new oil fields discovered in Saudi Arabia will not be developed; they will be saved for future generations. It is the sensible thing that many of us would do if it was our responsibility to run an oil-producing country.
What about renewable energies? Are they a real alternative for the future?
People think that renewable energy can solve all of our problems. They don’t understand that renewable energy is very limited. Everybody knows that the sun doesn’t shine at night and that the wind doesn’t blow all the time. These are fundamentals when you seriously consider at solar cells and wind energy. People have to get off the idea that if we just went to renewable energies, everything will be fine.
publishing date: June 20, 2008
Energy expert Robert Hirsch says the world would need 20 years to prepare for peak oil. But declining global oil production could just be a few years away. Read how we can prepare and ultimately “beat” this problem.
You were the lead author of a groundbreaking 2005 study on future oil production and declining reserves. How is the situation three years later?
Today, the situation is worse, and the reason for this is that it is now obvious that world oil production is already on a plateau. It has reached a high level, and has leveled off. The point at which oil production will decline is probably not far away.
If the world started (to implement solutions) 20 years before the peak oil problem, we would have stood a very good chance of beating the problem and could have avoided significant negative consequences for our economy. As it turns out, we now don’t have 20 years; we don’t even have 10. It wouldn’t surprise me at all if oil production begins to decline within the next few years.
What happens when we reach a peak in oil production?
Anybody can see how important oil is in our everyday lives. Oil is basically the lifeblood of all modern economies. When world oil production goes into decline, the decline rate will be three to five percent, maybe more if there is withholding from oil producers. Those numbers don’t sound very big, but when it comes to conserving or replacing that missing fuel, they are huge.
Oil prices are going to escalate dramatically. They were about 130 dollars this morning. That’s going to be a low price compared to what they are likely to escalate to. There will have to be rationing, and there will be huge problems as different countries try to get the oil they need to sustain some kind of economic well-being. We are racing towards a future that will be very difficult, and we have to do what is necessary to not economically kill ourselves.
What about new oil discoveries, like the recent ones in Brazil? Can they turn the tide?
They definitely cannot. To bring those new oil fields into production will require something like five to ten years. The infrastructure needed to drill and produce that oil is very significant. Contributions like Brazil will be of value, but there is no conceivable discovery or discoveries that can possibly turn the tide.
What about the people that say, once the oil price is high enough, new and unconventional sources like tar sands in Canada can be used to produce oil?
The point is directionally correct. The problem is that it takes a very long time to build the machinery that is necessary to exploit oil shale, oil sands, coal-to-liquids or heavy oil. In our 2005 analysis we looked at a worldwide crash program to bring these things into being as fast as possible. We made a number of aggressive assumptions, because a crash program is different from business as usual.
But the problem is that the magnitude of oil production loss each year will be so large and the time required to implement these alternatives is so long that the problem runs away from you if we wait too long. And we have waited too long to seriously start. Eventually, these otions and energy efficiency will catch up. It is not as if the world is going to die. But right now, we are looking at a global recession that deepens each year for more than a decade because we are not prepared.
How is the situation outside the United States?
No one has really started to work on the problem anywhere in the world, except maybe in China, where they calculated a few years ago that oil decline might occur around 2012. China has begun with coal liquefaction and other technologies. In addition, they have gone abroad and bought into oilfields around the world. They have probably done more than anyone else to prepare. In most places, the problem is still unthinkable and not politically correct. Most of the rest of the world is not in very good shape to deal with the problem.
Why do you think peak oil is such a taboo?
The thing that is foremost in people’s mind when it comes to energy is climate change. People have pushed hard and governments have taken actions to cut down on the emissions of CO2. But in many cases, decisions are opposite to what we need to mitigate the problem of declining world oil supplies.
For example, coal liquefaction will make very good sense in many areas of the world. Using and liquefying coal is an available technology, but under current conditions, there would be a great deal of CO2 released from making liquids out of coal. So people say, “no, we are not going do these things because of CO2.” They do not recognize that if we don’t take action on the impending oil decline, populations are going to suffer beyond what most can imagine.
Many Americans dream of energy independence. Is it still possible?
Energy independence in the next three or four decades is impossible for most countries outside of OPEC. The reason is that the magnitude of the problem is enormous. There are a few countries that could conceive of energy independence, the United States being one. But we really haven’t started, and we can’t even agree on what we really want and what’s important. Sadly, that is one of the reasons why it is going to take a deepening recession and a great deal of personal hurt to get people to rethink their values and get motivated to do what’s needed to pull us out of the problem.
The International Energy Agency says we do not have a problem with resources, we have a problem with investments. So the situation is not that bad?
Yes, there is an investment problem, but what is hard to understand for many economists and most people is that there is a conventional oil resource limitation, and that oil is what provides more than 90 percent of the liquid fuels we are using today. We are reaching the maximum in production. It will tail off over time, but at a rate that will be extremely difficult for us to catch up to.
Will producing countries profit heavily from such a situation?
The folks that have the resources will make much more money once prices escalate. They will be in a very strong financial position.
Most people don’t recognize that those countries don’t have an obligation to produce their oil for us. We might think that those people are financially motivated, but OPEC countries now are swimming in money. They are having trouble finding places to use their money.
So when the peak oil scenario hits, a number of oil exporting countries are likely to cut back on oil production. It makes sense for them to conserve their resources for future generations. So the situation will be worse than it might be from a purely geological or investment standpoint. The King of Saudi Arabia recently said that any new oil fields discovered in Saudi Arabia will not be developed; they will be saved for future generations. It is the sensible thing that many of us would do if it was our responsibility to run an oil-producing country.
What about renewable energies? Are they a real alternative for the future?
People think that renewable energy can solve all of our problems. They don’t understand that renewable energy is very limited. Everybody knows that the sun doesn’t shine at night and that the wind doesn’t blow all the time. These are fundamentals when you seriously consider at solar cells and wind energy. People have to get off the idea that if we just went to renewable energies, everything will be fine.
Tuesday, December 15, 2009
Optimistid-humanistid vs. nihilistid-apokalüptistid
There is no nihilism like the nihilism of a 9-year-old. "Why should I bother," one of them recently demanded of me, when he was presented with the usual arguments in favor of doing homework: "By the time I'm grown up, the polar ice caps will have melted and everyone will have drowned."
Watching the news from Copenhagen last weekend, it wasn't hard to understand where he got that idea. Among the tens of thousands demonstrating outside the climate change summit, some were carrying giant clocks set at 10 minutes to midnight, indicating the imminent end of the world. Elsewhere, others staged a "resuscitation" of planet Earth, symbolically represented by a large collapsing balloon. Near the conference center, an installation of skeletons standing knee-deep in water made a similar point, as did numerous melting ice sculptures and a melodramatic "die-in" staged by protesters wearing white, ghost-like jumpsuits.
Danish police arrested about a thousand people on Saturday for smashing windows and burning cars, and on Sunday arrested 200 more (they were carrying gas masks and seem to have been planning to shut down the city harbor). Nevertheless, in the long run it is those peaceful demonstrators, the ones who say the end is nigh, who have the capacity to do the most psychological damage.
I'll pause here to point out that I enthusiastically support renewable energy, believe strongly in the imposition of a carbon tax and am furthermore convinced that a worldwide shift away from fossil fuels would have hugely positive geopolitical consequences, even leaving aside the environmental benefits. It's true that I'm not crazy about the Kyoto climate negotiation process, of which the Copenhagen summit is the latest stage. But I'm even more disturbed by the apocalyptic and the anti-human prejudices of the climate change movement, some of which do indeed filter down to children as young as 9.
Over the years there have been many radical statements of this latter creed. In the infamous words of a National Park Service ecologist, "We have become a plague upon ourselves and upon the Earth. . . . Until such time as Homo sapiens should decide to rejoin nature, some of us can only hope for the right virus to come along." A former leader of People for the Ethical Treatment of Animals once declared that "humans have grown like a cancer; we're the biggest blight on the face of the earth." But it is a mistake to think that this is the language of only a crazy fringe.
Look, for example, at the Optimum Population Trust, a mainstream organization whose patrons include the naturalist David Attenborough, the scientist Jane Goodall and professors at Cambridge and Stanford -- and that campaigns against, well, human beings. Calling for "fewer emitters, lower emissions," the group offers members the chance to offset the pollution that they generate, merely by existing, through the purchase of family-planning devices in poor countries. Click on its PopOffsets calculator to see what I mean: It reckons that every $7 spent on family planning generates one ton fewer carbon emissions. Since the average American generates 20.6 tons of carbon annually, it will cost $144.20 -- $576.80 for a family of four -- to buy enough condoms to prevent the births of, say, 0.4 Kenyans.
The assumption behind this calculation is profoundly negative: that human beings are nothing more than machines for the production of carbon dioxide. And if we take that assumption seriously, a whole lot of other things look different, too. Weapons of mass destruction should perhaps be reconsidered, along with the flu virus: By reducing the population, they might also reduce emissions. Perhaps they should be encouraged?
Coupling all that with a firm conviction that the end of the world is nigh, you can see how homework is rendered pointless. As for hopes for the future and faith in humanity -- forget about it. But while we're at it, we might as well forget about reinventing our energy sources, too.
For while it's true that humans are often greedy, stupid and destructive, it's also true that we got to where we are at least partly thanks to human creativity, ingenuity and talent. Electricity is a miracle, an invention that has brought light and life to millions. Modern communication and transportation systems are no less extraordinary, helping to create economic growth in places where poverty and misery were the norm for centuries.
All of them depend on fossil fuels, but they don't have to: A profound change in the nature of human energy consumption is possible -- thanks to the entrepreneurship that created the Internet, the compassion that lies behind the advances in modern medicine and the scientific reasoning that sent men into space. As for nihilism and hatred of humankind, it teaches us nothing, except to give up. And we shouldn't be passing that on to our children either.
The inconvenient truth about malaria
Al Gore has made bold claims that climate change is aiding the spread of insect-borne diseases. The science does not support him, says Paul Reiter
Al Gore’s film, An Inconvenient Truth, was a masterpiece. Like an elder brother to all humanity, he patiently explained the familiar litany of disasters — droughts, floods, hurricanes, sea-level rise and the rest — spiced with heartrending personal stories: his baby son’s near-fatal accident, the agony of losing a sister to lung cancer. It was a science lecture crafted by Hollywood.
In his book — the version for adults, not the one for schoolchildren — he even included a colour photograph of a corpse, a young man, floating face downward, drowned by Hurricane Katrina. I wonder whether the dead boy’s family were consulted.
I am a scientist, not a climatologist, so I don’t dabble in climatology. My speciality is the epidemiology of mosquito-borne diseases. As the film began, I knew Mr Gore would get to mosquitoes: they’re a favourite with climate-change activists. When he got to them, it was all I feared.
In his serious voice, Mr Gore presented a nifty animation, a band of little mosquitoes fluttering their way up the slopes of a snow-capped mountain, and he repeated the old line: Nairobi used to be ‘above the mosquito line, the limit at which mosquitoes can survive, but now…’ Those little mosquitoes kept climbing.
The truth? Nairobi means ‘the place of cool waters’ in the Masai language. The town grew up around a camp, set up in 1899 during the construction of a railway, the famous ‘Lunatic Express’. There certainly was water there — and mosquitoes. From the start, the place was plagued with malaria, so much so that a few years later doctors tried to have the whole town moved to a healthier place. By 1927, the disease had become such a plague in the ‘White Highlands’ that £40,000 (equivalent to about £350,000 today) was earmarked for malaria control. The authorities understood the root of the problem: forest clearance had created the perfect breeding places for mosquitoes. The disease was present as high as 2,500m above sea level; the mosquitoes were observed at 3,000m. And Nairobi? 1,680m.
These details are not science. They require no study. They are history. But for activists, they are an inconvenient truth, so they ignore them. Even if Mr Gore is innocent, his advisers are not. They have been spouting the same nonsense for more than a decade. As scientists, we have repeatedly challenged them in the scientific press, at meetings and in news articles, and we have been ignored.
In 2004, nine of us published an appeal in the Lancet: ‘Malaria and climate change: a call for accuracy’. Clearly, Mr Gore didn’t read it. In 2000, I protested when Scientific American published a major article loaded with the usual misrepresentations. And when I watched his animated mosquitoes, his snow-capped mountain was oddly familiar. It took a few moments to click: the images were virtually identical to those in the magazine. The author of the article, Dr Paul Epstein, features high in Gore’s credits.
Dr Epstein is a member of a small band dedicated to a cause. And their work gains legitimacy, not by scholarship, but by repetition. While they publish their work in highly regarded journals, they don’t write research papers but opinion pieces and reviews, with little or no reference to the mainstream of science. The same claims, the same names; only the order of authors change. I have counted 48 separate pieces by just eight activists. They are myth-makers. And all have been lead authors and/or contributory authors of the prestigious IPCC assessment reports.
Take their contention, for example, that as a result of climate change, tropical diseases will move to temperate regions and malaria will come to Britain. If they bothered to learn about the subject, they would know that in a period climatologists call the Little Ice Age, when Charles II held ice parties on the Thames, malaria — ‘the ague’ — was rampant in the Essex marshes, on a par even with regions in Africa today. In the 18th century, the great systematist Linnaeus wrote his doctorate on malaria in central Sweden. In 1922-23 a massive epidemic swept the Soviet Union as far north as Archangel, on the Arctic circle, killing an estimated 600,000 people. And malaria was only eliminated from the Soviet Union and large areas of Europe in the 1950s, after the advent of DDT. So it’s hardly a tropical disease. And yet when we put this information under the noses of the activists it is ignored: ours is the inconvenient truth.
The activists also claim that malaria is already increasing in sub-Saharan Africa because of climate change, and that the people who are attacked by our climatic transgressions are those least able to defend themselves.
Science has a different angle. In the first place, malaria in most of sub-Saharan Africa is ‘stable’: everyone gets bitten by infective mosquitoes every year, sometimes as many as 300 times. So it is absurd to claim that climate change will increase the rate of infection; you cannot add water to a glass that’s already full.
On the other hand, in regions where malaria is newly arrived, or has emerged after a period of remission, a plethora of interacting factors are at play, including forest clearance, irrigation, the mobility of people, urbanisation, resistance to insecticides and antimalarial drugs, the Aids epidemic, population increase, the degradation of public health infrastructures, and war and civil strife. Most of all: poverty. Poverty and malaria go hand in hand. There is no evidence or need to implicate temperature.
When the Bush government nominated me as a lead author for the Intergovernmental Panel on Climate Change (IPCC), I knew I hadn’t a snowball’s chance of being accepted. The IPCC, supposedly formed of thousands of the world’s top scientists, is an ‘Intergovernmental’ panel. Governments nominate the authors, governments make their selections from those nominations, and governments must approve of all reports, line by line, before they are published. Moreover, the IPCC is a UN organisation, so its ‘top scientists’ are drawn from the 192 member countries of the UN Framework Convention on Climate Change. Each chapter must include two authors from developing countries and at least one from an emerging economy. Clearly, the people of the Maldives are not going to nominate a scientist like me, but if they did, I doubt the project would get very far: the IPCC Working Group II, based in Exeter, somehow happened to lose my nomination from their database.
At the end of his movie, Al Gore ridicules global warming ‘sceptics’ as a tiny and dwindling band of flat-earthers, people who believe the moon landings were staged, and accuses us of being richly rewarded by the oil industry. According to him, ‘the science is in’. End of discussion.
In truth, the science is never in. We’re not pollsters or policy-makers. We proceed by question, observation, hypothesis, and testing by experiment. We are still re-testing Einstein’s theory of relativity! So I’m happy to be a sceptic. That is how science works.
Paul Reiter
Al Gore’s film, An Inconvenient Truth, was a masterpiece. Like an elder brother to all humanity, he patiently explained the familiar litany of disasters — droughts, floods, hurricanes, sea-level rise and the rest — spiced with heartrending personal stories: his baby son’s near-fatal accident, the agony of losing a sister to lung cancer. It was a science lecture crafted by Hollywood.
In his book — the version for adults, not the one for schoolchildren — he even included a colour photograph of a corpse, a young man, floating face downward, drowned by Hurricane Katrina. I wonder whether the dead boy’s family were consulted.
I am a scientist, not a climatologist, so I don’t dabble in climatology. My speciality is the epidemiology of mosquito-borne diseases. As the film began, I knew Mr Gore would get to mosquitoes: they’re a favourite with climate-change activists. When he got to them, it was all I feared.
In his serious voice, Mr Gore presented a nifty animation, a band of little mosquitoes fluttering their way up the slopes of a snow-capped mountain, and he repeated the old line: Nairobi used to be ‘above the mosquito line, the limit at which mosquitoes can survive, but now…’ Those little mosquitoes kept climbing.
The truth? Nairobi means ‘the place of cool waters’ in the Masai language. The town grew up around a camp, set up in 1899 during the construction of a railway, the famous ‘Lunatic Express’. There certainly was water there — and mosquitoes. From the start, the place was plagued with malaria, so much so that a few years later doctors tried to have the whole town moved to a healthier place. By 1927, the disease had become such a plague in the ‘White Highlands’ that £40,000 (equivalent to about £350,000 today) was earmarked for malaria control. The authorities understood the root of the problem: forest clearance had created the perfect breeding places for mosquitoes. The disease was present as high as 2,500m above sea level; the mosquitoes were observed at 3,000m. And Nairobi? 1,680m.
These details are not science. They require no study. They are history. But for activists, they are an inconvenient truth, so they ignore them. Even if Mr Gore is innocent, his advisers are not. They have been spouting the same nonsense for more than a decade. As scientists, we have repeatedly challenged them in the scientific press, at meetings and in news articles, and we have been ignored.
In 2004, nine of us published an appeal in the Lancet: ‘Malaria and climate change: a call for accuracy’. Clearly, Mr Gore didn’t read it. In 2000, I protested when Scientific American published a major article loaded with the usual misrepresentations. And when I watched his animated mosquitoes, his snow-capped mountain was oddly familiar. It took a few moments to click: the images were virtually identical to those in the magazine. The author of the article, Dr Paul Epstein, features high in Gore’s credits.
Dr Epstein is a member of a small band dedicated to a cause. And their work gains legitimacy, not by scholarship, but by repetition. While they publish their work in highly regarded journals, they don’t write research papers but opinion pieces and reviews, with little or no reference to the mainstream of science. The same claims, the same names; only the order of authors change. I have counted 48 separate pieces by just eight activists. They are myth-makers. And all have been lead authors and/or contributory authors of the prestigious IPCC assessment reports.
Take their contention, for example, that as a result of climate change, tropical diseases will move to temperate regions and malaria will come to Britain. If they bothered to learn about the subject, they would know that in a period climatologists call the Little Ice Age, when Charles II held ice parties on the Thames, malaria — ‘the ague’ — was rampant in the Essex marshes, on a par even with regions in Africa today. In the 18th century, the great systematist Linnaeus wrote his doctorate on malaria in central Sweden. In 1922-23 a massive epidemic swept the Soviet Union as far north as Archangel, on the Arctic circle, killing an estimated 600,000 people. And malaria was only eliminated from the Soviet Union and large areas of Europe in the 1950s, after the advent of DDT. So it’s hardly a tropical disease. And yet when we put this information under the noses of the activists it is ignored: ours is the inconvenient truth.
The activists also claim that malaria is already increasing in sub-Saharan Africa because of climate change, and that the people who are attacked by our climatic transgressions are those least able to defend themselves.
Science has a different angle. In the first place, malaria in most of sub-Saharan Africa is ‘stable’: everyone gets bitten by infective mosquitoes every year, sometimes as many as 300 times. So it is absurd to claim that climate change will increase the rate of infection; you cannot add water to a glass that’s already full.
On the other hand, in regions where malaria is newly arrived, or has emerged after a period of remission, a plethora of interacting factors are at play, including forest clearance, irrigation, the mobility of people, urbanisation, resistance to insecticides and antimalarial drugs, the Aids epidemic, population increase, the degradation of public health infrastructures, and war and civil strife. Most of all: poverty. Poverty and malaria go hand in hand. There is no evidence or need to implicate temperature.
When the Bush government nominated me as a lead author for the Intergovernmental Panel on Climate Change (IPCC), I knew I hadn’t a snowball’s chance of being accepted. The IPCC, supposedly formed of thousands of the world’s top scientists, is an ‘Intergovernmental’ panel. Governments nominate the authors, governments make their selections from those nominations, and governments must approve of all reports, line by line, before they are published. Moreover, the IPCC is a UN organisation, so its ‘top scientists’ are drawn from the 192 member countries of the UN Framework Convention on Climate Change. Each chapter must include two authors from developing countries and at least one from an emerging economy. Clearly, the people of the Maldives are not going to nominate a scientist like me, but if they did, I doubt the project would get very far: the IPCC Working Group II, based in Exeter, somehow happened to lose my nomination from their database.
At the end of his movie, Al Gore ridicules global warming ‘sceptics’ as a tiny and dwindling band of flat-earthers, people who believe the moon landings were staged, and accuses us of being richly rewarded by the oil industry. According to him, ‘the science is in’. End of discussion.
In truth, the science is never in. We’re not pollsters or policy-makers. We proceed by question, observation, hypothesis, and testing by experiment. We are still re-testing Einstein’s theory of relativity! So I’m happy to be a sceptic. That is how science works.
Paul Reiter
Regional Climate Projections
Regional Climate Projections in the IPCC AR4

The climate projections presented in the IPCC AR4 are from the latest set of coordinated GCM simulations, archived at the Program for Climate Model Diagnosis and Intercomparison (PCMDI). This is the most important new information that AR4 contains concerning the future projections. These climate model simulations (the multi-model data set, or just ‘MMD’) are often referred to as the AR4 simulations, but they are now officially being referred to as CMIP3.
One of the most challenging and uncertain aspects of present-day climate research is associated with the prediction of a regional response to a global forcing. Although the science of regional climate projections has progressed significantly since last IPCC report, slight displacement in circulation characteristics, systematic errors in energy/moisture transport, coarse representation of ocean currents/processes, crude parameterisation of sub-grid- and land surface processes, and overly simplified topography used in present-day climate models, make accurate and detailed analysis difficult.
I think that the authors of chapter 11 over-all have done a very thorough job, although there are a few points which I believe could be improved. Chapter 11 of the IPCC AR4 working group I (WGI) divides the world into different continents or types of regions (e.g. ‘Small islands’ and ‘Polar regions’), and then discusses these separately. It provides a nice overview of the key climate characteristics for each region. Each section also provides a short round up of the evaluations of the performance of the climate models, discussing their weaknesses in terms of reproducing regional and local climate characteristics.
Africa.
The report asserts that the extent to which regional models can represent the local climate is unclear and that the limitation of empirical downscaling is not fully understood. It is nevertheless believed that land surface feedbacks have a strong effect on the regional climate characteristics.
For the future scenarios, the median value of the MMD GCM simulations (SRES A1b) yields a warming of 3-4C between 1980-1999 and 2080-2099 for the four different seasons (~1.5 times the global mean response). The GCMs project an increase in the precipitation in the tropics (ITCZ)/East Africa and a decrease in north and south (subtropics).
Europe and the Mediterranean.
A more detailed picture was drawn on the results from a research project called PRUDENCE, which represents a small number of TAR GCMs. The time was too short for finishing new dynamical downscaling on the MMD.
The PRUDENCE results, however, are more appropriate for exploring uncertainties associated with the regionalisation, rather than providing new scenarios for the future, since the downscaled results was based on a small selection of the GCMs from TAR.
Therefore, I was surprised to see such an extensive representation of the PRUDENCE project in this chapter, compared to other projects such as STARDEX and ENSEMBLES. (One explanation could be that the STARDEX results are used more in WGII, although apparently not cited. The results from ENSEMBLES are not yet published, and besides STARDEX is mentioned twice in section 11.10.)
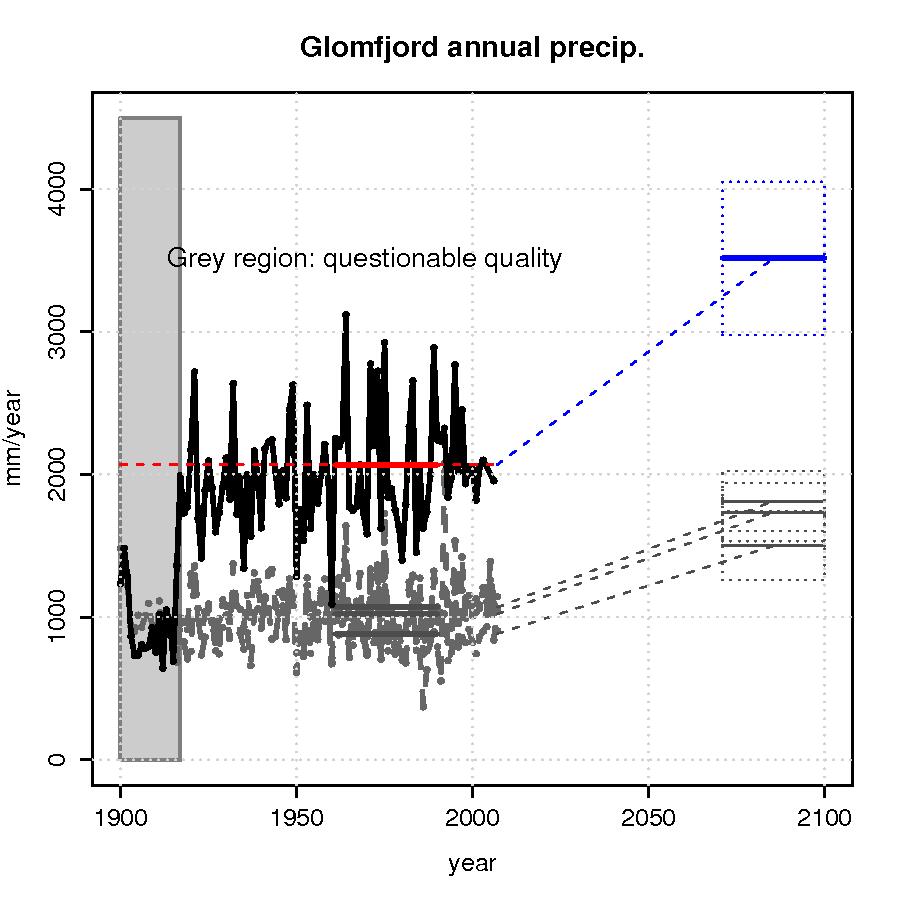
There are some results for Europe presented in chapter 11 of IPCC AR4 which I find strange: In Figure 11.6 the RCAO/ECHAM4 from the PRUDENCE project yields an increase in precipitation up to 70%(!) along the west coast of mid-Norway. Much of this is probably due to an enhanced on-shore wind due to a systematic lowering of the sea level pressure in the Barents Sea, and an associated orographic forcing of rain.
The 1961-90 annual total precipitation measured at the rain gauge at Glomfjord (66.8100N/13.9813E; 39 m.a.s.l.) is 2069 mm/year, and a 70% increase will therefore imply an increase to 3500mm/year (Left figure) which in my opinion is unrealistic . Apart from a sudden jump in the early part of the Glomfjord record, there are no clear and prominent trends in the historical time series (Figure left). The low values in the early part are questionable as the neighbouring station series do not exhibit similar jumps/breaks and is probably a result of a relocation of the rain gauges.
An increase of annual rainfall exceeding 1000mm would imply either that evaporation from the Norwegian Sea area must increase dramatically, or the moisture convergence must increase significantly since the water must come from somewhere. However, the whole region is already a wet region (as indicated by the annual rainfall totals) in the way of the storm tracks.
There are large local variations here (see grey curves in left Figure for nearby stations) and Glomfjord is a locations with high annual rainfall compared to other sites in the same area, but even a 70% increase of the rainfall with annual totals exceeding 1000mm at nearby sites (adjacent valleys etc) is quite substantial.
However, one may ask whether the rainfall at Glomfjord may change at a different rate to that of its surroundings. This question can only be addressed with empirical-statistical downscaling (ESD) at present, as RCMs clearly cannot resolve the spatial scales required.
To be fair, another PRUDENCE scenario presented in the same figure, but based on the HadAM3H model rather than the ECHAM4, suggests an upper limit for precipitation increase over northern Europe of 20% over northern Sweden.
Asia.

The Asian climate is also influenced by ENSO, but uncertainties in how ENSO will be affected by AGW cascades to the Asian climate.
There are, however, indications that heat waves will become more frequent and more intense. Furthermore, the MMD models suggest a decrease in the December-February precipitation and an increase in the remaining months. The models also project more intense rainfall over large areas in the future.
North America.
The MMD results project strongest winter-time warming in the north and summer-time warming in the southwest USA. The annual mean precipitation is, according to AR4, likely to increase in the north and decrease in southwest.
A stronger warming over land than over sea may possibly affect the sub-tropical high-pressure system off the west coast, but there are large knowledge gaps associated with this aspect.
The projections are associated with a number of uncertainties concerning dynamical features such as ENSO, the storm track system (the GCMs indicate a pole-ward shift, an increase in the number of strong cyclones and a reduction in the medium strength storms poleward of 70N & Canada), the polar vortex (the GCMs suggest an intensification), the Great Plains low-level jet, the North American Monsoon system, ocean circulation and the future evolution in the snow-extent and sea-ice. Some of these phenomena are not well-represented by the GCMs, as their spatial resolution is too coarse. The same goes for tropical cyclones (hurricanes), for which the frequency, intensity and track-statistics remain uncertain.
A number of RCM-based studies provide further regional details (North American Regional Climate Change Assessment Program). Despite improvements, AR4 also states that RCM simulations are sensitive to the choice of domain, the parameterisation of moist convection processes (representation of clouds and precipitation), and that there are biases in the RCM results when GCM are provided as boundary conditions rather than re-analyses.
Furthermore, most RCM simulations have been made for time slices that are too short to provide a proper statistical sample for studying natural variability. There are no references to ESD for North America in the AR4 chapter except for in the discussion on the projections for the snow.
Latin America.
The projections of the seasonal mean rainfall statistics for eg the Amazon forest are highly uncertain. One of the greatest sources of uncertainty is associated with how the character of ENSO may change, and there are large inter-model differences within the MMD as to how ENSO will be affected by AGW. Furthermore, most GCMs have small signal-to-noise ratio over most of Amazonia. Feedbacks from land use and land cover (including carbon cycle and dynamic vegetation) are not well-represented in most of the models.
Tropical cyclones also increase the uncertainty for Central America, and in some regions the tropical storms can contribute a significant fraction to the rainfall statistics. However, there has been little research on climate extremes and projection of these in Latin America.
According to AR4, deficiencies in the MMD models have a serious impact on the representation of local low-latitude climates, and the models tend to simulate ITCZs which are too weak and displaced too far to the south. Hence the rainfall over the Amazon basin tends to be under-estimated in the GCMs, and conversely over-estimated along the Andes and northeastern Brazil.
There are few RCM-simulations for Latin America, and those which have been performed have been constrained by short simulation lengths. The RCM results tend to be degraded when the boundary conditions are taken from GCMs rather than re-analyses. There is, surprisingly, no reference to ESD-based studies from Latin America, despite ESD being much cheaper to carry out and length of time interval being not an issue (I’ll comment on this below).
Australia & New Zealand.
The MMD projections for the monsoon rainfall show large inter-model differences, and the model projections for the future rainfall over northern Australia are therefore considered to be very uncertain.
Little has been done to asses the MMD skill over Australia and New Zealand, although analysis suggest that the MMD models in general have a systematic low-pressure bias near 50S (hence a southward displacement of the mid-latitude westerlies). The simulated seas around Australia has a slight warm bias too, and most models simulate too much rainfall in the north and too little on the east coast of Australia.
The quality of the simulated variability is also reported to be strongly affected by the choice of land-surface model.
The projections of changes is the extreme temperatures for Australia and New Zealand has followed a simple approach where the range of variations has been assumed to be constant while the mean has been adjusted according the the GCMs, thus shifting the entire statistical distribution. The justification for this approach is that the effect on changes in the range of short-term variations has been found to be small compared with changes in the mean.
Analysis for rainfall extremes suggest that the return period for extreme rainfall episodes may halve in late 21st century, even where the average level to some extent is diminishing. AR4 anticipates an increase in the tropical cyclone (TC) intensities, although there is no clear trends in frequency or location.
Furthermore, TCs are influenced by ENSO, for which there are no clear indications for the future behaviour. AR4 also states that there may be up to 10% increases in the wind over northern Australia.
AR4 states that downscaled MMD-based projections are not yet available for New Zealand, but such results are very much in need because of strong effects from the mountains on the local climate. High-resolution regional modeling for Australia is also based on TAR or ‘recent ‘runs with the global CSIRO glimate model. A few ESD studies by Timbal and others suggest good performance at representing climatic means, variability and extremes of station temperature and rainfall.
Polar regions.
However, the understanding of the polar climate is still incomplete, and large endeavors such as the IPY hope to address issues such as lack of decent observations, clouds, boundary layer processes, ocean currents, and sea ice.
AR4 states that all atmospheric models have incomplete parameterisations of polar cloud microphysics and ice crystal precipitation, however, the general improvement of the GCMs since TAR in terms of resolution, sea-ice modelling and cloud-radiation representation has provided improved simulations (assessed against re-analysis, as observations are sparse).
Part of the discussion about the Polar regions in AR4 relies on the ACIA report (see here , here and here for previous posts) in addition to the MMD results, but there are also some references to RCM studies (none to ESD-based work, although some ESD-analysis is embedded in the ACIA report). There has been done very little work on polar climate extremes and the projected changes to the cryosphere is discussed in AR4 chapter 10.
The models do in general provide a reasonable description of the temperature in the Arctic, with the exception of a 6-8C cold bias in the Barents Sea, due to the over-estimation of the sea-ice extent (the lack of sea-ice in the Barents Sea can be explained by ocean surface currents that are not well represented in GCMs). The MMD models suggest the winter-time NAO/NAM may become increasingly more positive towards the end of the century.
One burning question is whether is the response of the ice sheet will be enhanced calving/ice stream flow/basal melt. More snow will accumulate in Antarctica, as this ‘removes’ water from the oceans that otherwise would contribute to a global sea level rise. The precipitation in Antarctica, and hence snowfall, is projected to increase, thus partly offsetting the sea-level rise.
Small islands.
Most GCMs do not have sufficiently high spatial resolution to represent many of the islands, therefore the GCM projections really describe changes over ocean surfaces rather than land. Very little work has been done in downscaling the GCMs for the individual islands. However, there have been some ESD work for the Caribbean islands (AIACC).
Two sentences stating that ‘The time to reach a discernible signal is relatively short (Table 11.1)’ is a bit confusing as the discussion was referring to the 2080-2099 period (southern Pacific). After having conferred with the supplementary material, I think this means that the clearest climate change signal is seen during the first months of the year. Conversely when stating ‘The time to reach a discernible signal’ for the northern Pacific, probably refers to the last months of the year.
Other challenges involve incomplete understanding of some climatic processes, such as the midsummer drought in the Caribbean and the ocean-atmosphere interaction in the Indian Ocean.
Many of the islands are affected by tropical cyclones, for which the GCMs are unable to resolve and the trends are uncertain – or at least controversial.
Empirical-statistical or Dynamical downscaling?
AR4 chapter 11 makes little reference to empirical-statistical downscaling (ESD) work in the main section concerning the future projections, but puts most of the emphasis on RCMs and GCMs. It is only in Assessment of Regional Climate Projection Methods section (11.10) which puts ESD more into focus.
I would have thought that this lack of balance may not be IPCC’s fault, as it may be an unfortunate fact that there are few ESD studies around, but according to AR4 ‘Research on [E]SD has shown an extensive growth in application…’. If it were really the case that ESD studies were scarce, then it would be somewhat surprising, as ESD is quick and cheap (here, here, and here), and could have been applied to the more recent MMD, as opposed to the RCMs forced with the older generation GCMs.
ESD provides diagnostics (R2-statistics, spatial predictor patterns, etc.) which can be used to assess both the skill of the GCMs and the downscaling. I would also have thought that ESD is an interesting climate research tool for countries with limited computer resources, and it would make sense to apply ESD to for climate research and impact studies to meet growing concerns about local impacts of an AGW.
Comparisons between RCMs and ESD tend to show that they have similar skills, and the third assessment report (TAR) stated that ‘It is concluded that statistical downscaling techniques are a viable complement to process-based dynamical modelling in many cases, and will remain so in the future.’ This is re-phrased in AR4 as ‘The conclusions of the TAR that [E]SD methods and RCMs are comparable for simulating current climate still holds’.
So why were there so few references to ESD work in AR4?
I think that one reason is that ESD often may unjustifiably be seen as inferior to RCMs. What is often forgotten is that the same warnings also go for the parameterisation schemes embedded in the GCMs and RCMs, as they too are statistical models with the same theoretical weaknesses as the ESD models. AR4 does, however, acknowledge this: ‘The main draw backs of dynamical models are … and that in future climates the parameterization schemes they use to represent sub-grid scale processes may be operating outside the range for which they were designed’. However, we may be on a slippery slope with parameterisation in RCMs and GCMs, as the errors feed back to the calculations for the whole system.
Moreover, a common statement heard even among people who do ESD, is that the dynamical downscaling is ‘dynamical consistent’ (should not be confused with ‘coherent’). I question this statement, as there are issues of gravity wave drag schemes and filtering of undesirable wave modes, parameterisation schemes (often not the same in the GCM and the RCM), discretisation of continuous functions, and the conservation associated with time stepping, or lateral and lower boundaries (many RCMs ignore air-sea coupling).
RCMs do for sure have some biases,yet they are also very useful (similar models are used for weather forecasting). The point is that there are uncertainty associated with dynamical downscaling as well as ESD. Therefore it’s so useful to have two completely independent approaches for studying regional and local climate aspects, such as ESD and RCMs. One should not lock onto only one if there are several good approaches. The two approaches should be viewed as two complementary and independent tools for research, and both ought to be used in order to get a better understanding of the uncertainties associated with the regionalisation and more firm estimates on the projected changes.
Thus, the advantage of using different methods has unfortunately not been taken advantage of in chapter 11 of AR4 WGI to the full extent, which would have made the results even stronger. When this points was brought up during the review, the response from the authors of the chapter was:
This subsection focuses on projections of climate change, not on methodologies to derive the projections. ESD results are takan into account in our assessment but most of the available studies are too site- or area-specific for a discussion within the limited space that is available.
So perhaps there should be more coordinated ESD efforts for the future?
On a different note, the fact that the comments and the response are available on-line demonstrates that IPCC process is transparent indeed, showing that, on the whole, the authors have done a very decent job. The IPCC AR4 is the state-of-the-art consensus on climate change. One thing which could improve the process could also be to initiate more real-time dialog and discussion between the reviewers and the authors, in additional to the adopted one-way approach comment feed.
Uncertainties
One section in IPCC AR4 chapter 11 is devoted to a discussion on uncertainties, ranging from how to estimate the probability distributions to the introduction of additional uncertainties through downscaling. For instance, different sets of solutions are obtained for the temperature change statistics, depending on the approach chosen. The AR4 seems to convey the message that approaches based on the performance in reproducing past trends may introduce further uncertainties associated with (a) models not able to reproduce the historical (linear) evolution, and (b) the relationship between the observed and predicted trend rates may change in the future.
Sometimes the uncertainty has been dealt with by weighting different models according to their biases and convergence to the projected ensemble mean. The latter seems to focus more on the ‘mainstream’ runs.
AR4 stresses that multi-model ensembles only explore a limited range of the uncertainty. This is an important reminder for those interpreting the results. Furthermore, it is acknowledged that trends in large-area and grid-box projections are often very different from local trends within the area.
REALCLIMATE koos KOMMENTAARIDEGA
Subscribe to:
Posts (Atom)
