Wednesday, January 6, 2010

EROEI

EROEIst ja languse loogikast. Artikkel siit.

Diminishing Returns of Fossil Fuel Energy Invested

When investing money, everyone calculates how profitable that is, either in interest paid from bonds, dividends received from shares or cash flows from a business. But for all these investments to be successful we need energy. So how about energy supply projects: how much energy do they return for the energy invested?

This is the 4th post in a series on the best slides of the ASPO 2009 conference.http://www.aspousa.org/index.php/2009/11/2009-conference-proceedings/ There are 3 slide shows on the topic of energy returned on energy invested (EROEI):

(1) Hannes Kunz: Economic Scenarios for an Age of Declining EROIs
http://aspo-usa.com/2009presentations/Hannes_Kunz_Oct_11_2009.pdf
Institute for Integrated Economic Research http://www.iier.ch

(2) David Murphy: Recent Applications of Energy Return on Investment
http://aspo-usa.com/2009presentations/David_Murphy_Oct_11_2009.pdf
Web site: http://netenergy.theoildrum.com

(3) Jeff Vail: The Renewables Gap
http://aspo-usa.com/2009presentations/Jeff_Vail_Oct_11_2009.pdf
Home page: http://jeffvail.net

This is the general definition, a dimensionless factor which should be greater than 1:

eroei

http://en.wikipedia.org/wiki/EROEI

As an introduction let’s look how much energy is needed to produce oil itself. The latest work on this is here:

(4) A Preliminary Investigation of Energy Return on Energy Investment for Global Oil and Gas Production. July 2009
eroei_oil_gas_hall_et_al Nathan Gagnon, Charles A.S. Hall and Lysle Brinker
http://www.mdpi.com/1996-1073/2/3/490/pdf

The current EROEI is around 20, that is 1 unit energy invested yields 20 units of energy gained. But that figure was almost 35 just a couple of years ago. The graph shows that the energy efficiency of producing oil has peaked around 1999 and is now in decline. The reason for this is that out of 70 mb/d of crude oil production around 55 mb/d come from fields which are past their production peak (see http://www.crudeoilpeak.com/?p=355) and that means enhanced oil recovery (EOR) must be used to reduce decline rates. This EOR of course requires energy: heat for steam injection, pumping increasing amounts of water for maintaining reservoir pressure or building pipelines for gas injection. As an example, this article http://www.crudeoilpeak.com/?p=812 shows Saudi Arabia’s latest efforts in producing oil in Khurais. There is a lot of embedded energy in those oil/gas/water separation plants and the operation of these facilities also needs energy. The increasing number of offshore fields is also a reason for increased energy input requirements. Hannes Kunz (1) showed a nice slide to illustrate this:

eroi_oil_decreasing

eroei_oil_gas_trend_hall_et_al

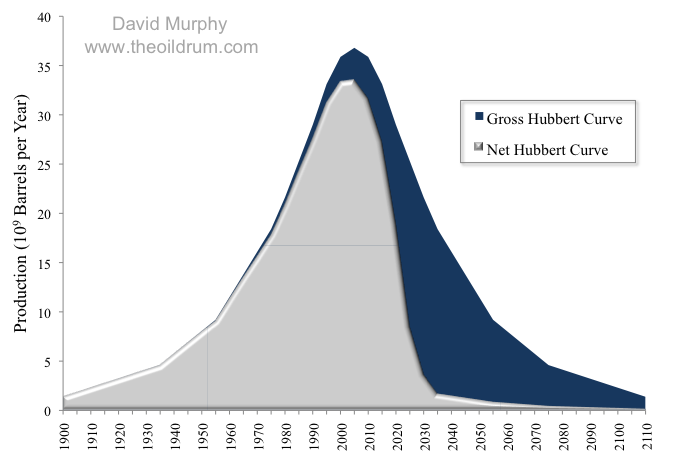
What could be the trends into the future? Figure 2 from (4) shows trends are declining, but it is not clear whether the future trend is linear or not. For a more detailed discussion see here: http://netenergy.theoildrum.com/node/5600#more But there will be a further decline and that is the important point. It will deform the Hubbert Curve to a net Hubbert curve as shown in this graph: http://www.theoildrum.com/files/Net%20Hubbert_6.png

An EROI of 1 means of course that for the purpose of producing oil as an energy source this is no longer energy profitable. But the minimum EROEIs are much higher than the theoretical limit of 1.

(a) EROEImin = 3 for transport only

(b) EROEImin= 8-10 to support society

“If the decline in EROI continues, then the amount of energy that will be available to sustain and grow the economy, both nationally and worldwide, will decline as well. The recent paper by Hall et al. ( (5) http://www.mdpi.com/1996-1073/2/1/25) on the minimum EROI for society indicates that society, even at its most basic level, cannot function on an EROI at the wellhead of less than about 3:1, and that considerably more than that would be required for the full suite of goods and services (such as medical care and education) that we have come to expect.”

eroi_energydelivered

David (2) gives more details on the EROEI for petrol, diesel and ethanol. The above paper (5) adds to the usual EROImm (at the mine mouth or farm gate) following definitions:

Energy returned at the point of use:

eroei_pou

and energy returned including the energy cost of infrastructure:

eroei_ext

david_murphy_implication_low_eroi_fuels

From (2): as we are going towards lower EROIs, society runs into a net energy cliff.

Hannes Kunz (1) shows the higher the speed the higher the energy costs :

eroei_transport

In order to avoid the net energy cliff we have to invest energy to build up genuinely renewable energy systems. Jeff Vail (3) warns of a renewable gap when replacing declining oil production

jeff_vail_renewables_gap

In http://www.jeffvail.net/labels/Renewables%20Hump.html Jeff calculates as follows:

1 million barrels * 1700 KWh /barrel / 24 h = 70.83 GW installed (heat equivalent)[1]

Assuming a net 5% decline in oil production (4.4 mb/d) that’s globally

4.4 * 30 years [energy return period] * 70.83 GW / 20 [EROI] = 467 GW installed

See data point on light blue curve for year 2. This curve declines because 5% from a declining oil production base is less in absolute terms every year.

This is a gigantic job on top of replacing/retrofitting existing coal fired power plants.

Let’s do this for Australian oil consumption of 870 kb/d and also a 5% decline (assuming functioning oil markets and no limits to the fungibility of oil, i.e. free exports and imports)

0.87 * 0.05 * 30 * 70.83 / 20 = 4.6 GW EVERY YEAR

Has anyone geared up industrial capacities to do this job? I’ll explore this in more detail in a later post. This calculation serves only the purpose of showing the magnitude of the task.

Conclusion:

There are 3 energy related tasks ahead:

(A) Replace coal fired power plants with renewable or low carbon energy systems
(B) Offset declining oil production with a renewable primary energy source (electricity and hydrogen are NOT energy sources, they are energy carriers)
(C) Set aside energy (=save from consumptive use of energy) to build up the new energy systems for A and B

In Australia:

Task (A) is about 40 GW over, say, 40 years, that is 1 GW/year – assuming there is no abrupt climate change which forces us to do the conversion faster, e.g. in 20 years. Task (B) is therefore 2-4 times bigger than that.

If we are not immediately doing (C) we’ll get stuck in jobs (A) and (B)

What are the practical policy implications?

(A) Do not add new energy hungry structures. But what does the NSW government plan? Yes, a mini Dubai in Darling Harbour. The steel in those skyscrapers (embedded oil for mining and CO2 emissions from coking coal!) should be used for e.g. building up wind farms to produce electricity for existing skyscrapers.

barangaroo_grand_slam

Neither do the architects seem to have heard about sea level rises (see external links).

http://www.smh.com.au/national/grand-slam-for-barangaroos-grand-plan-harbour-makeover-looks-like-worst-of-dubai-20091221-la26.html

Who will be fooled by this spin: Barangaroo to be carbon neutral

http://www.smh.com.au/environment/barangaroo-to-be-carbon-neutral-20091101-hrl5.html

(B) Do not build any more oil consuming tollways. But what does the NSW government plan? A widening of the M2:

m2_additional_lanes

http://buildingsydneymotorways.com.au/m2-a-lane-cove-tunnel-corridor/m2/planned-improvements

m5_corridor_expansion

http://buildingsydneymotorways.com.au/m5-corridor/m5-corridor-expansion

And an extension of the M5 because the air traffic is assumed to double. A complete disconnect to reality.

Download this article as PDF file: Diminishing Returns of Fossil Fuel Energy Invested [1.74 MB]

Economics and Limits to Growth: What's Sustainable?

Dr. Dennis Meadows esines Population Institute`is teemal kasvu piirid. Oil Drummi mehed olid kohal, tegid ettekandest lühikokkuvõtte ja samuti on võimalik kuulata/vaadata seda esinemist.


Slide 1

The reason I [Dr. Meadows] am giving this talk is because I think that there is the possibility of positive change.

Much of the way that we conduct ourselves is based on habit. For example, we get into the habit of crossing our arms with our right hand (or left hand) on top. It is not that putting the right hand or left hand on top is better or worse. We have just developed a habit of crossing our arms in a particular way.

If we are going to solve the population problem, we need to learn new habits. I am hopeful that like learning to cross our arms in a different way, we can inspire people to learn new habits that will limit population growth--something that is needed with finite resources.

My [Dr. Meadows'] views regarding what is sustainable are different now than they were 40 years ago. At that time, I worked with others at Massachusetts Institute of Technology to build a simple computer model that might offer some insight into the impact of limits to growth. We did not expect the model to be predictive--only that the scenarios might provide a rough boundaries regarding what might happen in the future.

In our reference scenario in 1972, we expected growth to continue for 40 to 80 more years. The major difference I see in looking at the situation now is that things seem to be developing more rapidly than we expected then.


Slide 2

Let's start by looking at our reference scenario. The red line shows where we were when the model was first developed. I have blocked out the fourth quadrant of the chart, because the world situation is likely to be so different from the situation we modeled that the model is likely to be totally irrelevant. The area shaded in light blue represents the time period that might possibility be changed by the policies we implement today.


Slide 3

In 1972, we expected another 40 to 80 years of growth in the various scenarios. While some of the scenarios we looked at ended in orderly decline, most of the scenarios we modeled ended in collapse. This likely outcome was later confirmed by William Catton in his book Overshoot.

You will note I say that technology may delay the end of growth a few years, but it does not avoid the end of growth or the decline. I have worked in science and technology, and I have a scientific degree, so I am not saying this because I am unaware of what technology can do. When we put together models using phenomenally optimistic assumptions, it just moved the decline date back a few years.

Social changes are essential for a better outcome. Take population for example. There are two ways population can decreased:

1. The birth rate can go down, or
2. The death rate can go up.

A key factor to understand is that what are normally considered problems today--for example, climate change, energy shortages, and erosion, aren't really problems. Instead, they are symptoms of attempted infinite growth in a finite world.

In some ways, the situation is like if you have a friend who has cancer, and because of the cancer he has a headache. It is not nice to have a headache, so you give your friend pain relievers, but you don't imagine you have cured the problem. The problem is cancer, and until you deal with the problem, there will be one or another manifestation, such as a head ache.

We talk a lot about climate change today. I predict that in three or four years, we won't be talking about climate change. We will be talking about energy scarcity or food shortages or declining water supplies. This will occur not because we have dealt with climate, but because it is one of a large family of pressures which are going to mount until finally physical growth stops.


Slide 4

[I do not believe that Dr. Meadows spoke directly about this slide, but I thought it was important for completeness.]


Slide 5

World population has been rising rapidly, and in our models, continues to rise.


Slide 7

World metal use is also rapidly increasing.


Slide 9

We have now reached overshoot. According to Wackernagel's analysis, we passed global capacity in 1980, eight years after our book was published. We are now about 40% above carrying capacity, according to his analysis.

In the early days, we had only models to tell us we were beyond carrying capacity. Now, we can look at the newspapers and get confirmation of the fact.


Slide 10

Kevin Noone published this image in Nature showing various areas where overshoot may manifest itself. Except for ozone, we are not making much progress in keeping physical stresses in limits. Some sectors appear not to have problems, but that is only because we do not have the situations quantified.


Slide 11

It was astonishing to me in 1972 that people could start from the assumption that there are no limits. It has been even more amazing to see the evolution to this thinking. Initially, the assumption was that people were just uninformed. The assumption was that if we can manage to give them the facts, they will change their opinion, and fall into line. Nothing I have seen in 40 years gives me support for that opinion. If you marshall enough facts to disprove an objection, then the critics will just find another objection. There are an infinite number of objections, so you are never going to come to the end of the process.

The above slide shows the sequence of objections. Now that it is clear that markets will not fix the situation, the belief is that technology will be the solution. Technology doesn't deal well with limits either. There are thermodynamic proofs of this.

Let me discuss some key assumptions in our model. William Catton mentions that there are three different ways we use space--one for extraction; one for activity; and one for basically dumping stuff. The first and third of these have costs associated with them.


Slide 12

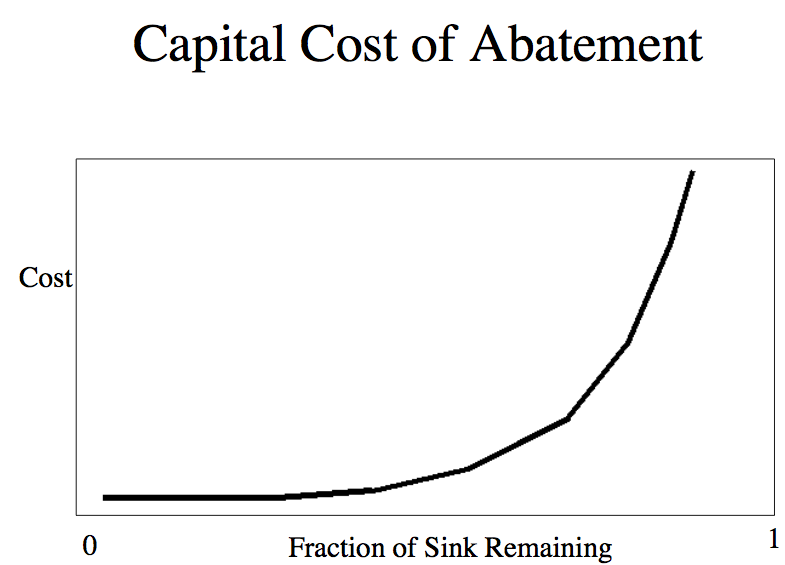
This is a generic curve, but I could show you empirically based versions of this curve for particular reserves. When you have 100% of a given resource, you can start to use it up, and you don't perceive any particular cost increase. It is only when you get past maybe 50%, 60% depletion that you start to see a radical rises in cost of extraction. We don't have time here, but I could explain why it behaves that way, and the reasons are not ones that can be changed by technology. Technology can shift the curve a little bit, but it can't alter the fact that well before you get to zero resource, the cost will become infinite.


Slide 13

And there is an analogous curve for dumps, where we try to put stuff. As the fraction of the sink is slowly occupied to a greater and greater extent, the cost of dealing with the consequences of production goes up rapidly.


Slide 14

Here is one particular example of the effect of these curves. It is the declining return on investment of energy. We built this country with energy that gave 70:1 to 100:1 energy payback. With domestic resources, we are now down to 10:1, 15:1 or 20:1 energy paybacks. You can see the trends are moving in a way which mean that well before the middle of the century, we will be dealing with energy resources that hardly break even. What you can do with 100:1 payback is enormously different than what you can do with a system that is generating only 2:1 or 3:1 payback. It is just that in the case of fossil fuels, we have used up many of the resources.

In our book, we describe the consequences of declining energy return. I won't get into great detail here, except to point out a couple of important features of our model.


Slide 15

Industrial growth occurs because of the positive feedback loop that occurs, depicted on the above chart. More capital gives you more output; more output permits more investment; and more investment lets you build up your capital stock. As long as investment exceeds depreciation, you have growth--exponential growth, and rapid rates of increase. Depending on how equitable society is, people, at least some people, get richer.

However, as we start to draw down our resources and fill up our sinks, more and more of the capital has to be drawn off to provide for the other needs. Eventually, you get to the point where you can't sustain production around the industrial capital loop sufficiently to sustain growth.

In our world model, it is the failure of model to produce enough output for capital reinvestment that tips you over into decline. We are moving now into that period.


Slide 16

Some people now looking at our curves would imagine that the periods of greatest stress would be after the peak--once the declines have set in. I don't think that is true. Right now, around the globe, we (that is corporate, political, and religious leaders) are working as hard as we can to sustain growth. For growth to stop, negative pressure have to mount until they are strong enough to offset our positive pressures. That's the period that we are in now. So I anticipate the big stresses are the ones we are going to encounter over the next couple of decades.


Slide 17

Let me give one very quick example in the two minutes that remain. Take CO2 concentration. Here again, we published this in 1972. You can see the red line and notice how quickly things accelerated after our book came out. No causal relationship there, but, on the other hand, it is pretty clear that no one paid any attention either. [Note by Gail: I wonder if the shift to debt based financing in this period helped "goose" growth.]

Why is it doing this? Everyone in the world wants greenhouse gasses to go down, but, by and large, they keep going up. Not only in the United States, which didn't sign the Kyoto Accord, but in all of the countries that did sign the Kyoto Accord.


Slide 18

Well, here we see the crucial role of population. The chart shows CO2 emissions as a function of four factors:

1. Number of people.
2. Number of units of capital per person, which is a surrogate for living standards.
3. The amount of energy required to build and operate that capital.
4. The fraction of that energy that comes from non-fossil sources.

So far, our concern about climate change had manifested itself through efforts to improve efficiency and to implement alternative energy sources--the so-called technology options. I will just close by pointing out that as long as we ignore demographic and cultural issues, the growth in the first two factors will continue to offset all of the improvement we make in factors 3 and 4. And so until we can understand how to begin reducing the growth in the first two factors, climate change is a foregone conclusion.

[Dr. Meadows finished with a little clapping game to show that actions speak louder than words with respect to reducing population growth. He did not finish all of his slides--which is why I have omitted some.]

[Postscript by Gail. Dr. Meadows clearly sees capital somewhat differently than I have been looking at it. His model does not seem to incorporate debt. To me, it seems like debt allows resource developers effectively to obtain capital temporarily for nothing, by promising some of the future output of the positive feedback loop shown in Slide 15, including interest, back to lenders. When returns start slipping (because of the two forces Dr. Meadows mentions--higher resource extraction costs and higher costs of handling pollution sinks)--there is not enough money to pay back money lenders, and the system starts unraveling quickly, as we have recently been witnessing.

I think that inequity in the sharing of the outputs of the resource loop shown in Slide 15 is helping the system to continue to provide the level of capital investment that is now being provided. If the outputs were being shared equally, we would find that workers would be benefiting proportionately with bankers, and rich countries would be benefiting proportionately with poor countries. Our children would have an equal chance at getting high-paying jobs that we who are parents of young adults have had. This inequity in sharing seems to me to play a big part in what funds for re-investment remain.

The recent emphasis on renewables is in the direction of causing even higher capital needs. To the extent that this takes needed capital away from unglamorous parts of the system that are necessary for the system to survive, it could lead the system to fail earlier than it otherwise would.]

Monday, January 4, 2010

Euroopa koopereerub, et ehitada "taastuvenergia supergrid"

Ouna AntsRe: Alternatiivenergia kasutuselevõtust teenivad firmad04/01/10 21:55

Uue aasta alguse puhul ka üks särav visioon:
guardian.co.uk on Energy: Sun, wind and wave-powered: Europe unites to build renewable energy 'supergrid'

Idee on siis vana - ühendada väga erinevate Euroopa piirkondade erinevat liiki elektrijaamad omavahel kõrgepinge-alalisvoolu kaablitega. Nii kasutatakse vaheldumisi tuule-, päikese-, laine- ja hüdroenergiat. Piirkondade vahelised ühendused võimaldaks kasutada näiteks Norra hüdroelektrijaamade võrku kui hiiglaslikku looduslikku akut. Samas oleks võimalik kasutusele võtta ka võimsaid tuule- ja päikeseenergiaparke, mis omaette ei tuleks kõne alla.
Tundub, et Euroopa Liidu lubadus – aastaks 2020 pärineb 20% energiast taastuvatest energiaallikatest – ei ole üdini ebarealistlik.
Võrgu hind: € 30B (=£ 26.5bn).

Sunday, January 3, 2010

Monday, December 28, 2009

OzBot vahendab LHV foorumist

tohlakasRe: Kui palju inimtegevus kliimat mõjutab?15/12/09 00:56
Mehed ja naised, vaatame tõele näkku - me kõik siin foorumis oleme hedonistid, kes oma mugavast pesas tarbivad meelelahutust, mida maailm meile pakub interneti, CNN-i ja igasuguste teiste infotainment kanalite kaudu. Kõik teevad näo, et nad hoolivad, tegelikult me tarbime omaks meelelahutuseks seda stuffi. Käime toredal rahvamatkal Kopenhaagenis näiteks, et näidata, kuidas me eriliselt hoolime jne... Loomulikult teeme me panuseid erinevatele võitluskukkedele, aga see on pigem puhas meelelahutus. Ütleks ausalt välja, et mind ei koti, kas ma pean säästupirne ostma või bensiini eest rohkem maksma. Oma tarbimisharjumusi ma nagunii ei muuda, sest mulle ei meeldi näiteks saasta süüa ja kehva jooke juua. Samuti ei meeldi mulle halva autoga sõita ning koleda naisega armatseda. Aga see selleks, ei maksa teha nägu, et see kõik meile koledalt korda läheks. Ma tean väga hästi, et biokütuste tootmine on kuritegelik nälgivate inimeste suhtes, aga ilmselt siis on vaja kliimaprobleemi nime all maailma rahvastikku vähendada, või mis iganes. Puhas darwinism. Ja kui ma näen, et CO2-ga kauplemine teeb mind rikkamaks, siis ilmselt ma panustan oma rahanatukest ka sellese sektorisse.

http://www.lhv.ee/forums/index.cfm?id=196424&start=951#974

Maailmalõpuarengute proxy play

suffiksRe: Arco Vara (ARC1T)27/11/09 19:06
Arco tulemustest lõik:
9 kuu seisuga pole täiendavalt diskonteeritud nõuet AS Ühendatud Kapitali vastu,
mille bilansiline maksumus on hetkel 64,1 mln krooni (4,1 mln eurot). 20.11.2009
toimus Tallinna Arbitraažikohtu I istung, mille otsus tehakse osapooltele
teatavaks eeldatavasti 21.12.2009.


Ehk Tallinna Arbitraazhikohus teeb otsuse Arco suhtes täpselt 3 aastat enne maiade poolt ennustatud ja Roland Emmerichi poolt kinnitatud maailmalõppu. Coincidence? I think not.

Edaspidi tuleb järelikult jälgida Arcoga toimuvat, kuna tegu on ilmselgelt maailmalõpuarengute proxy playga.

Thursday, December 24, 2009

Copenhagen climate change conference 2009 Copenhagen climate conference How do I know China wrecked the Copenhagen deal? I

Guardian

Copenhagen was a disaster. That much is agreed. But the truth about what actually happened is in danger of being lost amid the spin and inevitable mutual recriminations. The truth is this: China wrecked the talks, intentionally humiliated Barack Obama, and insisted on an awful "deal" so western leaders would walk away carrying the blame. How do I know this? Because I was in the room and saw it happen.

China's strategy was simple: block the open negotiations for two weeks, and then ensure that the closed-door deal made it look as if the west had failed the world's poor once again. And sure enough, the aid agencies, civil society movements and environmental groups all took the bait. The failure was "the inevitable result of rich countries refusing adequately and fairly to shoulder their overwhelming responsibility", said Christian Aid. "Rich countries have bullied developing nations," fumed Friends of the Earth International.

All very predictable, but the complete opposite of the truth. Even George Monbiot, writing in yesterday's Guardian, made the mistake of singly blaming Obama. But I saw Obama fighting desperately to salvage a deal, and the Chinese delegate saying "no", over and over again. Monbiot even approvingly quoted the Sudanese delegate Lumumba Di-Aping, who denounced the Copenhagen accord as "a suicide pact, an incineration pact, in order to maintain the economic dominance of a few countries".

Sudan behaves at the talks as a puppet of China; one of a number of countries that relieves the Chinese delegation of having to fight its battles in open sessions. It was a perfect stitch-up. China gutted the deal behind the scenes, and then left its proxies to savage it in public.

Here's what actually went on late last Friday night, as heads of state from two dozen countries met behind closed doors. Obama was at the table for several hours, sitting between Gordon Brown and the Ethiopian prime minister, Meles Zenawi. The Danish prime minister chaired, and on his right sat Ban Ki-moon, secretary-general of the UN. Probably only about 50 or 60 people, including the heads of state, were in the room. I was attached to one of the delegations, whose head of state was also present for most of the time.

What I saw was profoundly shocking. The Chinese premier, Wen Jinbao, did not deign to attend the meetings personally, instead sending a second-tier official in the country's foreign ministry to sit opposite Obama himself. The diplomatic snub was obvious and brutal, as was the practical implication: several times during the session, the world's most powerful heads of state were forced to wait around as the Chinese delegate went off to make telephone calls to his "superiors".

Shifting the blame

To those who would blame Obama and rich countries in general, know this: it was China's representative who insisted that industrialised country targets, previously agreed as an 80% cut by 2050, be taken out of the deal. "Why can't we even mention our own targets?" demanded a furious Angela Merkel. Australia's prime minister, Kevin Rudd, was annoyed enough to bang his microphone. Brazil's representative too pointed out the illogicality of China's position. Why should rich countries not announce even this unilateral cut? The Chinese delegate said no, and I watched, aghast, as Merkel threw up her hands in despair and conceded the point. Now we know why – because China bet, correctly, that Obama would get the blame for the Copenhagen accord's lack of ambition.

China, backed at times by India, then proceeded to take out all the numbers that mattered. A 2020 peaking year in global emissions, essential to restrain temperatures to 2C, was removed and replaced by woolly language suggesting that emissions should peak "as soon as possible". The long-term target, of global 50% cuts by 2050, was also excised. No one else, perhaps with the exceptions of India and Saudi Arabia, wanted this to happen. I am certain that had the Chinese not been in the room, we would have left Copenhagen with a deal that had environmentalists popping champagne corks popping in every corner of the world.

Strong position

So how did China manage to pull off this coup? First, it was in an extremely strong negotiating position. China didn't need a deal. As one developing country foreign minister said to me: "The Athenians had nothing to offer to the Spartans." On the other hand, western leaders in particular – but also presidents Lula of Brazil, Zuma of South Africa, Calderón of Mexico and many others – were desperate for a positive outcome. Obama needed a strong deal perhaps more than anyone. The US had confirmed the offer of $100bn to developing countries for adaptation, put serious cuts on the table for the first time (17% below 2005 levels by 2020), and was obviously prepared to up its offer.

Above all, Obama needed to be able to demonstrate to the Senate that he could deliver China in any global climate regulation framework, so conservative senators could not argue that US carbon cuts would further advantage Chinese industry. With midterm elections looming, Obama and his staff also knew that Copenhagen would be probably their only opportunity to go to climate change talks with a strong mandate. This further strengthened China's negotiating hand, as did the complete lack of civil society political pressure on either China or India. Campaign groups never blame developing countries for failure; this is an iron rule that is never broken. The Indians, in particular, have become past masters at co-opting the language of equity ("equal rights to the atmosphere") in the service of planetary suicide – and leftish campaigners and commentators are hoist with their own petard.

With the deal gutted, the heads of state session concluded with a final battle as the Chinese delegate insisted on removing the 1.5C target so beloved of the small island states and low-lying nations who have most to lose from rising seas. President Nasheed of the Maldives, supported by Brown, fought valiantly to save this crucial number. "How can you ask my country to go extinct?" demanded Nasheed. The Chinese delegate feigned great offence – and the number stayed, but surrounded by language which makes it all but meaningless. The deed was done.

China's game

All this raises the question: what is China's game? Why did China, in the words of a UK-based analyst who also spent hours in heads of state meetings, "not only reject targets for itself, but also refuse to allow any other country to take on binding targets?" The analyst, who has attended climate conferences for more than 15 years, concludes that China wants to weaken the climate regulation regime now "in order to avoid the risk that it might be called on to be more ambitious in a few years' time".

This does not mean China is not serious about global warming. It is strong in both the wind and solar industries. But China's growth, and growing global political and economic dominance, is based largely on cheap coal. China knows it is becoming an uncontested superpower; indeed its newfound muscular confidence was on striking display in Copenhagen. Its coal-based economy doubles every decade, and its power increases commensurately. Its leadership will not alter this magic formula unless they absolutely have to.

Copenhagen was much worse than just another bad deal, because it illustrated a profound shift in global geopolitics. This is fast becoming China's century, yet its leadership has displayed that multilateral environmental governance is not only not a priority, but is viewed as a hindrance to the new superpower's freedom of action. I left Copenhagen more despondent than I have felt in a long time. After all the hope and all the hype, the mobilisation of thousands, a wave of optimism crashed against the rock of global power politics, fell back, and drained away.